Exploiting The Non-Farm Payrolls Drift

Anyone that’s been around the markets knows that the monthly release of the United States Department of Labor’s Non-Farm Payrolls (NFP) data can have a tremendous impact, especially in the short term. NFP is a snapshot of the state of the employment situation in the US, representing the total number of paid workers, excluding farm …

Read more

How To Get Historical S&P 500 Constituents Data For Free

spx constituents historical mean return

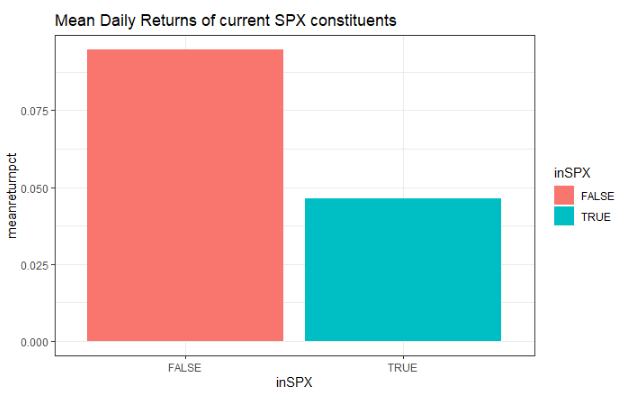
In this post, we are going to construct snapshots of historic S&P 500 index constituents, from freely available data on the internet. Why? Well, one of the biggest challenges in looking for opportunities amongst a broad universe of stocks is choosing what stock “universe” to look at. One approach to dealing with this is to …

Read more

Kalman Filter Pairs Trading with Zorro and R

In the first three posts of this mini-series on pairs trading with Zorro and R, we: Implemented a Kalman filter in R Implemented a simple pairs trading algorithm in Zorro Connected Zorro and R and exchanged data between the two platforms In this fourth and final post, we’re going to put it all together and …

Read more

Kalman Filter Example:
Pairs Trading in R

This Kalman Filter Example post is the first in a series where we deploy the Kalman Filter in pairs trading. Be sure to follow our progress in Part 2: Pairs Trading in Zorro, and Part 3: Putting It All Together. Anyone who’s tried pairs trading will tell you that real financial series don’t exhibit truly …

Read more

Pattern Recognition with the Frechet Distance

Chart patterns have long been a favourite of the technical analysis community. Triangles, flags, pennants, cups, heads and shoulders…. Name a shape, someone somewhere is using it to predict market behaviour. But, we need to find out if there is a grain of truth or reliability in these patterns. Can attempts to objectively measure these …

Read more

Can you apply factors to
trade performance?

When tinkering with trading ideas, have you ever wondered whether a certain variable might be correlated with the success of the trade? For instance, maybe you wonder if your strategy tends to do better when volatility is high? In this case, you can get very binary feedback by, say, running backtests with and without a …

Read more

Backtesting Bias:
Feels Good, Until You Blow Up

In an ideal trading universe (free from backtesting bias), we’d all have a big golden “causation magnifying glass”. Through the lens of this fictional tool, you’d zoom in and understand the fleeting, enigmatic nature of the financial markets, stripping bare all its causes and effects. Knowing exactly what causes exploitable inefficiencies would make predicting market …

Read more

Dual Momentum Investing: A Quant’s Review

I recently read Gary Antonacci’s book Dual Momentum Investing: An Innovative Strategy for Higher Returns with Lower Risk, and it was clear to me that this was an important book to share with the Robot Wealth community. It is important not only because it describes a simple approach to exploiting the “premier anomaly” (Fama and French, …

Read more

Back to Basics Part 3: Backtesting in Algorithmic Trading

  This is the final post in our 3-part Back to Basics series. You may be interested in checking out the other posts in this series: Part 1: An Introduction to Algorithmic Trading Part 2: How to Succeed at Algorithmic Trading We’ve also compiled this series into an eBook which you can download for free …

Read more

Exploring Mean Reversion and Cointegration: Part 2

In the first Mean Reversion and Cointegration post, I explored mean reversion of individual financial time series using techniques such as the Augmented Dickey-Fuller test, the Hurst exponent and the Ornstein-Uhlenbeck equation for a mean reverting stochastic process. I also presented a simple linear mean reversion strategy as a proof of concept. In this post, I’ll …

Read more