

ah, I see a blue star pattern on my chart… a good omen.
The problem is that such an approach is inherently subjective since price action almost never matches perfectly with the idealized version of price patterns you see in every beginner’s guide to trading. It is up to you, the individual, to determine whether a particular chart formation matches closely enough with a particular pattern for it to be considered valid. This is quite tricky! It’s very difficult to codify a trading system based on their use. By extension, it is difficult to test the efficacy of these patterns in an objective, evidence-based manner. That won’t stop smart people from trying, though. An attempt to do just this was made by MIT’s Andrew Lo, Harry Mamaysky and Jian Wang back in 20001and, perhaps surprisingly, they found statistically significant evidence that some patterns provide useful incremental information in some markets. Lo, Mamaysky and Wang were also generally enthusiastic about using automated detection methods. There are many possible approaches to pattern detection algorithms, of which Zorro implements one: a function that calculates the Frechet distance. So, let’s dive in and explore it!Frechet Distance
The Frechet distance between two curves is a measure of their similarity — it’s often described like so: Suppose a man is walking his dog and that he is forced to walk on a particular path and his dog on another path. Both the man and the dog are allowed to control their speed independently but are not allowed to go backwards. Then, the Fréchet distance of the two paths is the minimal length of a leash that is necessary to keep man and dog joined throughout their walk.
there are a lot more variables in the real world….
If the Frechet distance between two curves is small, it follows that the curves are similar. Conversely, a large Frechet distance implies that the curves are not similar. So, we can leverage the Frechet distance as a pattern detection algorithm by comparing sections of the price curve to a curve corresponding to a pattern of interest, for example, a triangle. A small Frechet distance implies that the section of the price curve that was analyzed is similar to the pre-defined pattern. There have been a whole bunch of algorithms proposed over the years for calculating Frechet distance (it was first described in 1906), and Zorro implements a simple variant that enables the comparison of some part of a price curve with a known and previously described pattern. Zorro’s frechet() function returns a number between approximately 0 and 80 that measures the similarity of the part of the price curve being analyzed and the pattern. Note that this is proportional to the inverse of the Frechet distance, in that a larger similarity measure implies a smaller Frechet distance. frechet() takes the following arguments:- A series (usually asset prices) to be compared with a predefined pattern
- An integer TimeFrame which sets the number of price bars to use in the comparison, that is, the horizontal length of the pattern in the price curve (setting this to zero tells Zorro to simply use the same length as the predefined pattern).
- A var, Scale , specifying the vertical size of the pattern in the price chart. Setting this to a negative number inverts the pattern.
- An array of positive numbers specifying the shape of the pattern to be detected. The final value of the array must be zero, which is used by the algorithm to signal the termination of the pattern.
Describing Chart Patterns as Arrays
If we want to detect chart patterns, the first thing we need to define is the shape of that pattern. Note that in describing our pattern in an array, we only need to be concerned with its shape. We can deal with its size (both horizontally and vertically) using other frechet() arguments. Therefore don’t focus too much on the absolute values of the numbers that describe the pattern – their relative values are much more important here. To define a pattern in an array, think of an (x, y) coordinate plane. The array indexes are the (x) values; the numbers stored in each index are the corresponding (y) values. We then map our pattern as a series of (x,y) pairs. Here’s an example for a triangle pattern: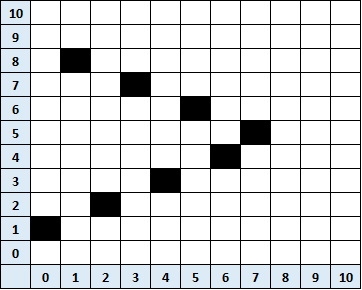 Remembering that zero terminates the pattern, the corresponding array would consist of the numbers 1, 8, 2, 7, 3, 6, 4, 5, 0. We would define such an array as
var Triangle[9] = {1, 8, 2, 7, 3, 6, 4, 5, 0};
The obvious question that arises from this approach is how well does the algorithm detect patterns that we would consider a triangle, but which deviate from the idealized triangle shown above?
For example, what about asymmetry in the legs of the triangle? That is, what if the early legs take longer to complete than later legs? In the example above, all the legs take the same amount of time. What about triangles that don’t terminate at the apex?
By way of example, the following would probably fit the definition of a triangle:
Remembering that zero terminates the pattern, the corresponding array would consist of the numbers 1, 8, 2, 7, 3, 6, 4, 5, 0. We would define such an array as
var Triangle[9] = {1, 8, 2, 7, 3, 6, 4, 5, 0};
The obvious question that arises from this approach is how well does the algorithm detect patterns that we would consider a triangle, but which deviate from the idealized triangle shown above?
For example, what about asymmetry in the legs of the triangle? That is, what if the early legs take longer to complete than later legs? In the example above, all the legs take the same amount of time. What about triangles that don’t terminate at the apex?
By way of example, the following would probably fit the definition of a triangle:
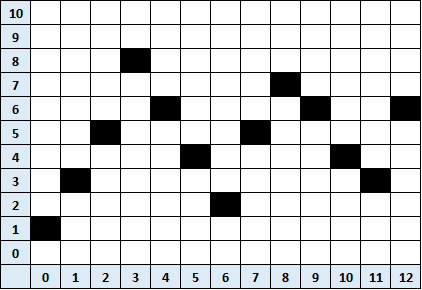 But now our array would be given by 1, 3, 5, 8, 6, 4, 2, 5, 7, 6, 4, 3, 6, 0. That is,
var Triangle[14] = {1,3,5,8,6,4,2,5,7,6,4,3,6,0};
Would these two patterns return different Frechet similarities when applied to the same price curve?
The answer is yes. But, bear in mind that a pattern corresponding to the first triangle will still be somewhat similar to the second triangle. In practice, this means that in order to use this approach effectively, we would need to cover our bases and check for multiple variants of the intended pattern, perhaps using some sort of confirmation between different variations of the pattern. We’ll see in the example below how much variation we see in our similarity measure for different variants of the same intended pattern.
But now our array would be given by 1, 3, 5, 8, 6, 4, 2, 5, 7, 6, 4, 3, 6, 0. That is,
var Triangle[14] = {1,3,5,8,6,4,2,5,7,6,4,3,6,0};
Would these two patterns return different Frechet similarities when applied to the same price curve?
The answer is yes. But, bear in mind that a pattern corresponding to the first triangle will still be somewhat similar to the second triangle. In practice, this means that in order to use this approach effectively, we would need to cover our bases and check for multiple variants of the intended pattern, perhaps using some sort of confirmation between different variations of the pattern. We’ll see in the example below how much variation we see in our similarity measure for different variants of the same intended pattern.
Setting the Pattern’s Vertical Height
The Scale parameter controls the vertical height of the pattern being searched in the price curve. This is the same as stretching the predefined pattern in the direction of price in a price chart. In most cases, it will make sense to set the height of the pattern to the range of the price action over the period of interest. We do this automatically by setting the Scale parameter based on the maximum and minimum values of the price series over the time period of interest via Zorro’s MaxVal() and MinVal() functions: Scale = MaxVal(Data, TimeFrame) – MinVal(Data, TimeFrame);Setting the Pattern’s Horizontal Length
The TimeFrame parameter controls the pattern’s horizontal length and corresponds to the number of bars over which to apply the pattern. This is the same as stretching the predefined pattern in the direction of time on a price chart. This parameter requires a little more thought because there are no hard and fast rules regarding how long these patterns should take to form. Again, we must deal with the inherent subjectivity of the method. Rather than constraining our pattern detection algorithm to a single time period, why not simply look over multiple time periods? We could do this by calling frechet() within a for() loop that increments the TimeFrame parameter on every iteration, like so:for(i=5;i<100;i+=5)
{
frechet(Price, i, 100*PIP, Triangle);
}
This will search for a pattern called “Triangle” that is 100 pips high over multiple time ranges, from 5 bars to 100 bars. In practice, we don’t really need to cover every incremental number of bars (1,2,3,4 etc) because patterns evolving over similar time horizons will tend to return similar frechet() values. For example, a pattern evolving over 10 bars will be similar to the same pattern evolving over 11 bars. In the example above, we increment our search length by 5 bars.
Putting it All Together
We are now in a position to start detecting patterns and analyzing their usefulness as trading signals. The code below plots the Frechet similarity metric for our symmetric and asymmetric triangles, and their inverses, over a number of time horizons. We use the strf() function to enable us to pass a variable (in this case, the integer i ) into a string (in this case, the name of the plot) so that we can plot the different Frechet similarities from within the for() loop:/* PLOT FRECHET SIMILARITY
*/
function run()
{
set(PLOTNOW);
StartDate = 20150712;
EndDate = 20150826;
BarPeriod = 1440;
LookBack = 100;
asset("SPX");
vars Price = series(priceClose());
static var Tri_Sym[9] = {1,8,2,7,3,6,5,4,0};
static var Tri_Asym[14] = {1,3,5,8,6,4,2,5,7,6,4,3,6,0};
int i;
for(i=10;i<=30;i+=10)
{
plot(strf("Tri_Sym_%d", i),frechet(Price, i, MaxVal(Price,i) - MinVal(Price,i), Tri_Sym),NEW,RED);
plot(strf("Tri_Asym_%d", i),frechet(Price, i, MaxVal(Price,i) - MinVal(Price,i), Tri_Asym),0,BLUE);
plot(strf("Tri_Sym_Inv_%d", i),frechet(Price, i, -(MaxVal(Price,i) - MinVal(Price,i)), Tri_Sym),NEW,BLACK);
plot(strf("Tri_Asym_Inv_%d", i),frechet(Price, i, -(MaxVal(Price,i) - MinVal(Price,i)), Tri_Asym),0,GREEN);
}
PlotWidth = 800;
PlotScale = 15;
PlotHeight1 = 500;
PlotHeight2 = 125;
}
Here we zoom into an area of the S&P500 index that saw a fairly obvious triangle develop from early July through to mid-August 2015:
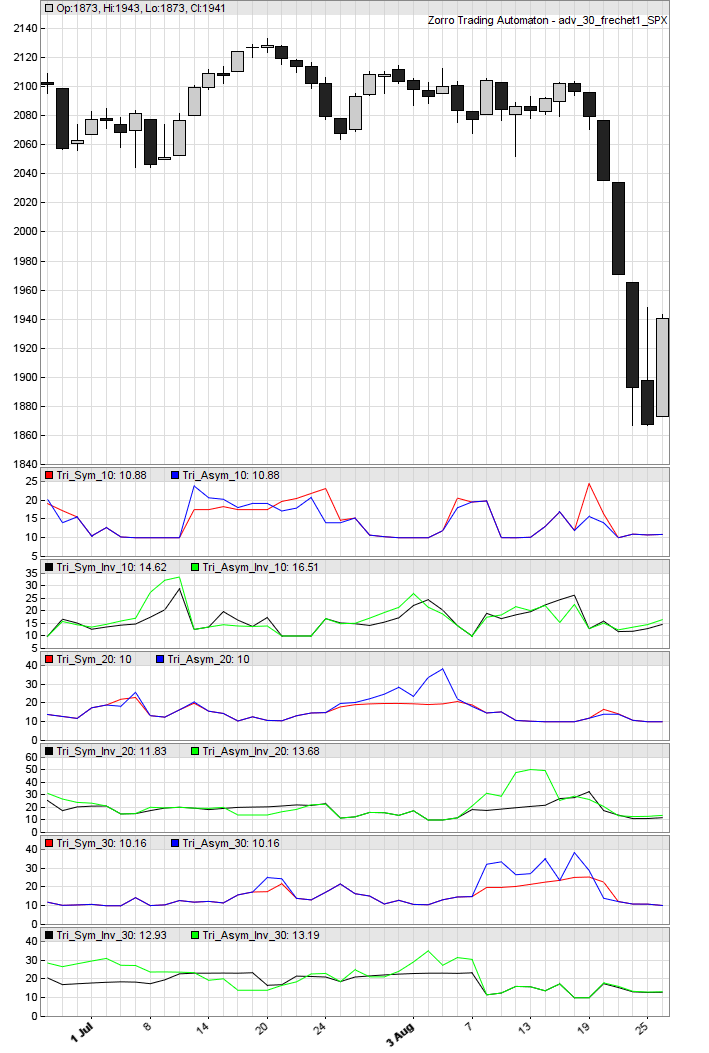 You can see that most variants of our Frechet algorithm detected the triangle at some point during its evolution. In particular, the asymmetric inversive triangle measured over 20 days did a particularly good job of recognizing the triangle, reaching a similarity score of approximately 50 as the triangle approached its apex.
Looking more closely at other regions will reveal that the algorithm is far from perfect, sometimes scoring patterns that we would rather exclude relatively highly. This makes it difficult to differentiate the “true” patterns on the basis of some threshold similarity score. To overcome that, we could perhaps continue to refine our pattern definitions or implement a series of confirmations from different variations, but that would get tedious fairly quickly.
Here’s an example of a simple trading strategy that looks for our asymmetric triangle pattern across several time horizons. Again using the strf() function, we switch to a new Algo for each time horizon. I read somewhere that gold is particularly prone to triangle formations, so we’ll use the GLD Exchange Traded Fund. I also read that triangles are allegedly indicators of a strong breakout in any direction.
I don’t know whether this has any basis in fact, but let’s go with it for the purpose of the exercise.
On the basis of the alleged triangle behavior, when one is detected we bracket the market at a quarter of the 20-day ATR. We leave our pending orders for a maximum of 10 days, but no longer than the time horizon used to detect the pattern. Likewise, we close our trades after a maximum of 20 days, but no longer than the time horizon.
There’s much more you could do here, for example cancelling the remaining pending order when the opposite one is executed.2The code uses Alpha Vantage’s API for getting the required GLD historical data, so you’ll need to set this up in your Zorro.ini file if you don’t already have this data.
You can see that most variants of our Frechet algorithm detected the triangle at some point during its evolution. In particular, the asymmetric inversive triangle measured over 20 days did a particularly good job of recognizing the triangle, reaching a similarity score of approximately 50 as the triangle approached its apex.
Looking more closely at other regions will reveal that the algorithm is far from perfect, sometimes scoring patterns that we would rather exclude relatively highly. This makes it difficult to differentiate the “true” patterns on the basis of some threshold similarity score. To overcome that, we could perhaps continue to refine our pattern definitions or implement a series of confirmations from different variations, but that would get tedious fairly quickly.
Here’s an example of a simple trading strategy that looks for our asymmetric triangle pattern across several time horizons. Again using the strf() function, we switch to a new Algo for each time horizon. I read somewhere that gold is particularly prone to triangle formations, so we’ll use the GLD Exchange Traded Fund. I also read that triangles are allegedly indicators of a strong breakout in any direction.
I don’t know whether this has any basis in fact, but let’s go with it for the purpose of the exercise.
On the basis of the alleged triangle behavior, when one is detected we bracket the market at a quarter of the 20-day ATR. We leave our pending orders for a maximum of 10 days, but no longer than the time horizon used to detect the pattern. Likewise, we close our trades after a maximum of 20 days, but no longer than the time horizon.
There’s much more you could do here, for example cancelling the remaining pending order when the opposite one is executed.2The code uses Alpha Vantage’s API for getting the required GLD historical data, so you’ll need to set this up in your Zorro.ini file if you don’t already have this data.
/* FRECHET TRADING

*/

var threshold = 30;

function run()
{
    set(PLOTNOW);
    StartDate = 2007;
    EndDate = 2017;
    BarPeriod = 1440;
    AssetList = "AssetsIB";
    if(is(INITRUN)) assetHistory("GLD", FROM_AV);
    asset("GLD");

   vars Price = series(priceClose());
   var Tri_Asym[14] = {1,3,5,8,6,4,2,5,7,6,4,3,6,0};

   int i;
   for(i=10;i<=50;i+=10)
   {
    algo(strf("_%d_Asym", i));
    if(frechet(Price, i, MaxVal(Price,i)-MinVal(Price,i), Tri_Asym) > threshold)
        {
            Entry = 0.25*ATR(20);
            EntryTime = min(i, 10);
            LifeTime = min(i, 20);
            if(NumOpenLong == 0) enterLong();
            if(NumOpenShort == 0) enterShort();
        }
   }

   PlotWidth = 800;
   PlotHeight1 = 500;
   PlotHeight2 = 125;
}
Here’s the equity curve:
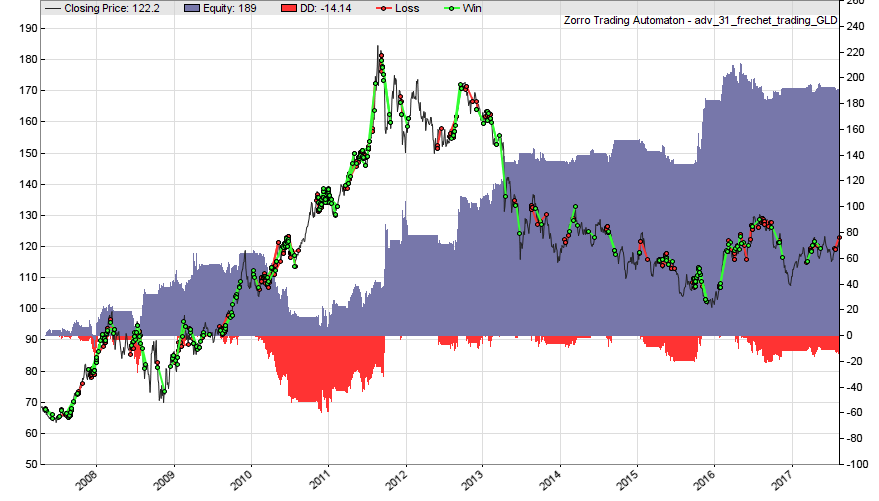 You’ll find that such a trading strategy is difficult to apply directly to a universe of potential assets.
The effect of randomness, combined with the difficulty in refining pattern definitions sufficiently, invites overfitting to the parameters of the frechet() function, not to mention selection bias. You’ll also be faced with the decision to trade a pattern detected at multiple time horizons.
Maybe a system of confirmations from numerous pattern variations would help, but perhaps a more practical application for the trader interested in patterns is to use frechet() to scan a universe of assets and issue email or SMS alerts, or display a message listing assets where a pattern was detected for further manual analysis. Maybe we’ll cover this in a future blog post if you’re interested, let me know in the comments below.
You’ll find that such a trading strategy is difficult to apply directly to a universe of potential assets.
The effect of randomness, combined with the difficulty in refining pattern definitions sufficiently, invites overfitting to the parameters of the frechet() function, not to mention selection bias. You’ll also be faced with the decision to trade a pattern detected at multiple time horizons.
Maybe a system of confirmations from numerous pattern variations would help, but perhaps a more practical application for the trader interested in patterns is to use frechet() to scan a universe of assets and issue email or SMS alerts, or display a message listing assets where a pattern was detected for further manual analysis. Maybe we’ll cover this in a future blog post if you’re interested, let me know in the comments below.
Some Patterns to Get You Started
Here are some rather idealized patterns to get you started. I leave it up to you to experiment with various departures from their idealized forms.var rectangle[5] = {1,2,1,2,0};
var cup[10] = {6,3,2,1,1,1,2,3,6,0};
var zigzag[5] = {1,7,2,8,0};
var headShldrs[17] = {1,2,3,3,3,4,5,6,6,5,4,3,3,3,2,1,0};
var cup[10] = { 6,3,2,1,1,1,2,3,6,0 };
var triangle_symmetric[9] = {1,8,2,7,3,6,5,4,0};
var triangle_assymetric[14] = {1,3,5,8,6,4,2,5,7,6,4,3,6,0};
Want a more robust and profitable approach to trading? Gain a broader understanding of how we use algorithms to trade systematically and make our capital grow by downloading the free Algo Basics PDF below.
After that, check out our other blog post where we outline how we approach the markets in a way that allows us to trade for a living.
Free Case Study:
A wantaway engineer’s journey into professional trading and out again
I went from engineering to an equity partnership at a prop trading firm to running my own systematic trading operation from home in Western Australia.
This case study is the full story – every mistake, every breakthrough, and some things I trade today.


Thanks for sharing, VERY informative!
Interesting approach.