A Simple Trick for Dealing with Overlapping Data

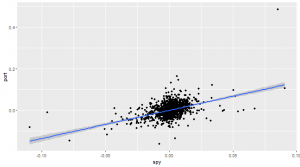
Last week, we looked at simple data analysis techniques to test for persistence. But we only looked at a feature that is measured over a single day – the absolute range. Such a feature makes it easy to test persistence because you don’t have the problem of overlapping data. Each data point is entirely self-contained …

Read more

More Intuitive Joins in dplyr 1.1.0 – how to do an asof join on trades and quotes data

dplyr 1.1.0 was a significant release that makes several common data operations more syntactically intuitive. The most significant changes relate to joins and grouping/aggregating operations. In this post we’ll look at the changes to joins. First, install and load the latest version of dplyr: install.packages(“dplyr”) library(dplyr) A new approach to joins The best way to …

Read more

Working with Tidy Financial Data in tidyr

Holding data in a tidy format works wonders for one’s productivity. Here we will explore the tidyr package, which is all about creating tidy data. In particular, let’s develop an understanding of the tidyr::pivot_longer and tidyr::pivot_wider functions for switching between different formats of tidy data. In this video, you’ll learn: What tidy data looks like …

Read more

Performant R Programming: Chunking a Problem into Smaller Pieces

When data is too big to fit into memory, one approach is to break it into smaller pieces, operate on each piece, and then join the results back together. Here’s how to do that to calculate rolling mean pairwise correlations of a large stock universe. Background We’ve been using the problem of calculating mean rolling …

Read more

How to Fill Gaps in Large Stock Data Universes Using tidyr and dplyr

When you’re working with large universes of stock data you’ll come across a lot of challenges: Stocks pay dividends and other distributions that have to be accounted for. Stocks are subject to splits and other corporate actions which also have to be accounted for. New stocks are listed all the time – you won’t have …

Read more

Handling a Large Universe of Stock Price Data in R: Profiling with profvis

Recently, we wrote about calculating mean rolling pairwise correlations between the constituent stocks of an ETF. The tidyverse tools dplyr and slider solve this somewhat painful data wrangling operation about as elegantly and intuitively as possible. Why did you want to do that? We’re building a statistical arbitrage strategy that relies on indexation-driven trading in …

Read more

How to Wrangle JSON Data in R with jsonlite, purr and dplyr

Working with modern APIs you will often have to wrangle with data in JSON format. This article presents some tools and recipes for working with JSON data with R in the tidyverse. We’ll use purrr::map functions to extract and transform our JSON data. And we’ll provide intuitive examples of the cross-overs and differences between purrr …

Read more

How to Calculate Rolling Pairwise Correlations in the Tidyverse

How might we calculate rolling correlations between constituents of an ETF, given a dataframe of prices? For problems like this, the tidyverse really shines. There are a number of ways to solve this problem … read on for our solution, and let us know if you’d approach it differently! First, we load some packages and …

Read more

Financial Data Manipulation in dplyr for Quant Traders

In this post, we’re going to show how a quant trader can manipulate stock price data using the dplyr R package. Getting set up and loading data Load the dplyr package via the tidyverse package. if (!require(‘tidyverse’)) install.packages(‘tidyverse’) library(tidyverse) First, load some price data. energystockprices.RDS contains a data frame of daily price observations for 3 …

Read more