
DataRTrading infrastructure
A Beginner’s Guide to Using DuckDB with Stock Price Data in R
In this blog post, I will demonstrate how to work with stock price data using the DuckDB database management system
In this blog post, I will demonstrate how to work with stock price data using the DuckDB database management system
Towards the end of last year, we ran a couple of free Zoom webinars on: Here are the recordings: Basics
dplyr 1.1.0 was a significant release that makes several common data operations more syntactically intuitive. The most significant changes relate
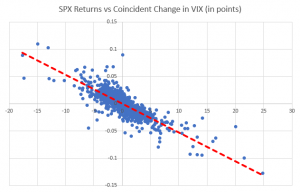
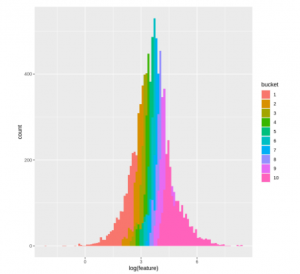
If you have some factor that you think predicts future stock returns (or similar) and you are making charts like

I’ve been helping a family friend with his trading. I’ve given him a simple systematic strategy to trade by hand.

Earlier versions of Zorro used to ship with a script for converting market data in Zorro binary format to CSV.
I have been sharing examples of simple real-time trading research on my Twitter account. I do this kind of thing a

I’m a big fan of Ernie Chan’s quant trading books: Quantitative Trading, Algorithmic Trading, and Machine Trading. There are some

This post presents an analysis of the SPY returns process using the QuantConnect research platform. QuantConnect is a strategy development
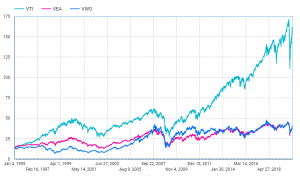
In this post, we explain how to use SQL to extend back ETF price data with total return data from
In the world of Big Data, there are lots of tools and technologies to choose from. Choosing the “right” one
Holding data in a tidy format works wonders for one’s productivity. Here we will explore the tidyr package, which is