Quant trading
Tesla’s inclusion in the S&P 500 – Is there a trade?
The S&P index committee recently announced that Tesla, already one of the biggest stocks listed in the country, would be
The S&P index committee recently announced that Tesla, already one of the biggest stocks listed in the country, would be

Colaboratory, or Colab, is a hosted Jupyter notebook service requiring zero setup and providing free access to compute resources. It

You rarely meet a rich forex trader. I’ve met plenty of rich traders who trade quant factors or stat arb.

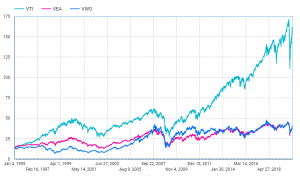
Here’s a chart of long-term asset performance…. The blue line shows returns from US stocks from 1900 to today.

I recently listened to a podcast about one of the earliest human civilizations – the ancient Sumerians. Apparently, our system

I was very sad to learn that Quantopian is shutting down its community services. Quantopian’s efforts to bring quant finance

This is a review of Positional Option Trading by Euan Sinclair. Trading books set a low bar for the reviewer.

This post presents an analysis of the SPY returns process using the QuantConnect research platform. QuantConnect is a strategy development
In this post, we explain how to use SQL to extend back ETF price data with total return data from
Nearly everyone starts trading with unrealistic expectations. “If I make a 0.5% returns every day I can make over $100k