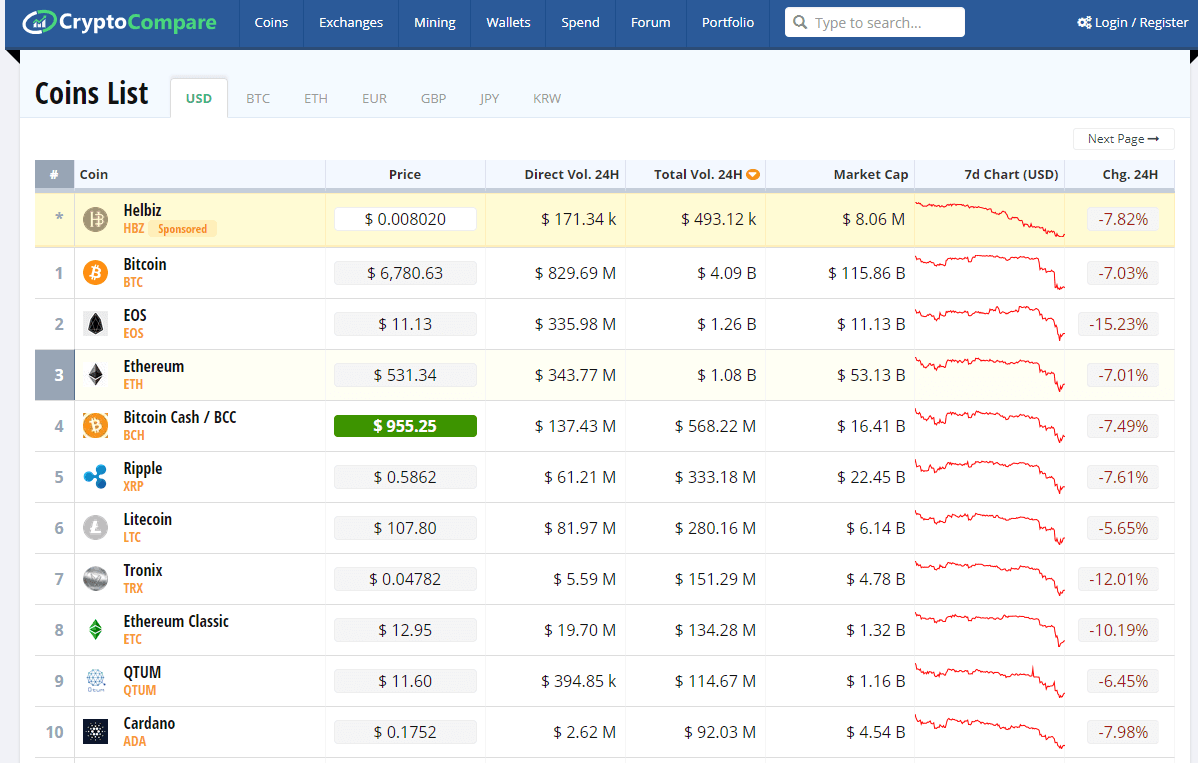
Cryptocompare is a platform providing data and insights on pretty much everything in the crypto-sphere, from market data for cryptocurrencies to comparisons of the various crytpo-exchanges, to recommendations for where to spend your crypto assets. The user-experience is quite pleasant, as you can see from the screenshot of their real-time coin comparison table:

As nice as the user-interface is, what I really like about Cryptocompare is its API, which provides programmatic access to a wealth of crypto-related data. It is possible to drill down and extract information from individual exchanges, and even to take aggregated price feeds from all the exchanges that Cryptocompare is plugged into – and there are quite a few!
Interacting with the Cryptocompare API
When it comes to interacting with Cryptocompare’s API, there are already some nice Python libraries that take care of most of the heavy lifting for us. For this post, I decided to use a library called cryptocompare . Check it out on Git Hub here.
You can install the current stable release by doing pip install cryptocompare , but I installed the latest development version direct from Git Hub, as only that version had support for minutely price history at the time of writing.
To install the dev version from Git Hub, do:
pip install git+https://github.com/lagerfeuer/cryptocompare.git
This version will limit you to one month’s worth of daily price data and one week’s worth of hourly data. If you’re feeling adventurous, you can install the version that I forked into my own Git Hub account and modified to increase those limits. To do that, you’ll need to do:
pip install git+https://github.com/kplongdodd/cryptocompare.git
Now that we’ve got our library of API functions, let’s take a look at what we can do with Cryptocompare!
List all Available Coins
To get a list of all the coins available on Cryptocompare, we can use the following Python script:
import numpy as np
import pandas as pd
import cryptocompare as cc
# list of coins
coin_list = cc.get_coin_list()
coins = sorted(list(coin_list.keys()))
At the time of writing, this returned a list of 2,609 coins! By comparison, there are around 2,800 stocks listed on the New York Stock Exchange.
Coins by Market Capitalisation
Let’s focus on the biggest players in crypto-world: the coins with the largest market capitalisation.
We can get price data for a list of coins using the function cryptocompare.get_price() and if we specify full=True , the API will return a whole bunch of data for each coin in the list, including last traded price, 24-hour volume, number of coins in circulation, and of course market capitalisation.
Cryptocompare’s API will only allow us to pass it a list of coins that contains no more than 300 characters at any one time. To get around that limitation, we’ll pass lists of 50 coins at a time, until we’ve passed our entire list of all available coins.
The API returns a json string, which we can interpret as a dictionary in Python. Note that the outer-most keys in the resulting dictionary are ‘RAW’ and ‘DISPLAY’ which hold the raw data and data formatted for better displaying respectively. In our case, we prefer to work with the raw data, so we’ll keep it and discard the rest.
Here’s the code for accomplishing all that:
# get data for all available coins
coin_data = {}
for i in range(len(coins)//50 + 1):
    # limited to a list containing at most 300 characters #
    coins_to_get = coins[(50*i):(50*i+50)]
    message = cc.get_price(coins_to_get, curr='USD', full=True)
    coin_data.update(message['RAW'])
coin_data now contains a whole bunch of dictionaries-within-dictionaries that hold our data. Each outer key corresponds to a coin symbol, and looks like this:
'ZXT': {'USD': {'CHANGE24HOUR': 0,
    'CHANGEDAY': 0,
    'CHANGEPCT24HOUR': 0,
    'CHANGEPCTDAY': 0,
    'FLAGS': '4',
    'FROMSYMBOL': 'ZXT',
    'HIGH24HOUR': 2.01e-06,
    'HIGHDAY': 2.01e-06,
    'LASTMARKET': 'CCEX',
    'LASTTRADEID': '1422076',
    'LASTUPDATE': 1491221170,
    'LASTVOLUME': 998,
    'LASTVOLUMETO': 0.0020059799999999997,
    'LOW24HOUR': 2.01e-06,
    'LOWDAY': 2.01e-06,
    'MARKET': 'CCCAGG',
    'MKTCAP': 0,
    'OPEN24HOUR': 2.01e-06,
    'OPENDAY': 2.01e-06,
    'PRICE': 2.01e-06,
    'SUPPLY': 0,
    'TOSYMBOL': 'USD',
    'TOTALVOLUME24H': 0,
    'TOTALVOLUME24HTO': 0,
    'TYPE': '5',
    'VOLUME24HOUR': 0,
    'VOLUME24HOURTO': 0,
    'VOLUMEDAY': 0,
    'VOLUMEDAYTO': 0}},
That ‘USD’ key is common to all the coins in coin_data and it specifies the counter-currency in which prices are displayed. That key is going to be troublesome when we turn our dictionary into a more analysis-friendly data structure, like a pandas DataFrame , so let’s get rid of it:
# remove 'USD' level
for k in coin_data.keys():
    coin_data[k] = coin_data[k]['USD']
Now we can go ahead and create a DataFrame from our coin_data dictionary and sort it by market capitalization:
coin_data = pd.DataFrame.from_dict(coin_data, orient='index')
coin_data = coin_data.sort_values('MKTCAP', ascending=False)
All good so far, but interrogating this data by doing coin_data[‘MKTCAP’].head(20) reveals that the coin with the highest market cap is something called AMO:
coin_data['MKTCAP'].head(20)
Out[3]:
AMO       1.928953e+13
WBTC*     1.421202e+11
BTC       1.156607e+11
BITCNY    6.769687e+10
ETH       5.327990e+10
NPC       3.108324e+10
XRP       2.222890e+10
XUC       1.644538e+10
BCH       1.623158e+10
EOS       1.103000e+10
VERI      7.803077e+09
PRPS      7.342302e+09
LTC       6.087482e+09
MTN       5.000000e+09
TRX       4.731000e+09
XLM       4.628553e+09
ADA       4.485383e+09
DCN       3.928000e+09
IOT       3.863547e+09
VEN       3.330000e+09
Wouldn’t we expect that honour to go to Bitcoin, with symbol BTC? And what about all those other coins that you’ve probably never heard of? What’s going on here?
It turns out that Cryptocompare includes data for coins that haven’t yet gone to ICO, and it appears that in such cases, the market capitalisation calculation is done using the pre-ICO price of the coin, and its total possible supply of coins.
That’s going to skew things quite significantly, so let’s exclude any coins from our list that haven’t traded in the last 24 hours. We can get this information from the TOTALVOLUME24H field, which is the total amount the coin has been traded in 24 hours against all its trading pairs:
# exclude coins that haven't traded in last 24 hours
# TOTALVOLUME24H is the amount the coin has been traded
# in 24 hours against ALL its trading pairs
coin_data = coin_data[coin_data['TOTALVOLUME24H'] != 0]
coin_data[‘MKTCAP’].head() now looks a lot more sensible:
coin_data['MKTCAP'].head()
Out[4]:
BTC    1.156607e+11
ETH    5.327990e+10
XRP    2.222890e+10
XUC    1.644538e+10
BCH    1.623158e+10
Get Market Data for Top Coins
We can get the last month’s historical daily data for the 100 top coins by market cap, stored as a dictionary of DataFrames, by doing the following:
top_coins = coin_data[:100].index
df_dict = {}
for coin in top_coins:
    hist = cc.get_historical_price_day(coin, curr='USD')
    if hist:
        hist_df = pd.DataFrame(hist['Data'])
        hist_df['time'] = pd.to_datetime(hist_df['time'], unit='s')
        hist_df.index = hist_df['time']
        del hist_df['time']
        df_dict[coin] = hist_df
And we can access the data for any coin in the dictionary by doing df_dict[coin] where coin is the symbol of the coin we interested in, such as ‘BTC’. Now that we have our data, we can do some fun stuff!
You will need to use the version of cryptocompare from my Git Hub repo (see above) in order to get enough to data to reproduce the examples below. In that case, once you’ve downloaded my version, just replace line 5 in the script above with
hist = cc.get_historical_price_day(coin, curr='USD', limit=2000)
Some Basic Analysis
First, let’s pull out all the closing prices from each DataFrame in our dictionary:
# pull out closes
closes = pd.DataFrame()
for k, v in df_dict.items():
    closes[k] = v['close']
# re-order by market cap
closes = closes[coin_data.index[:100]]
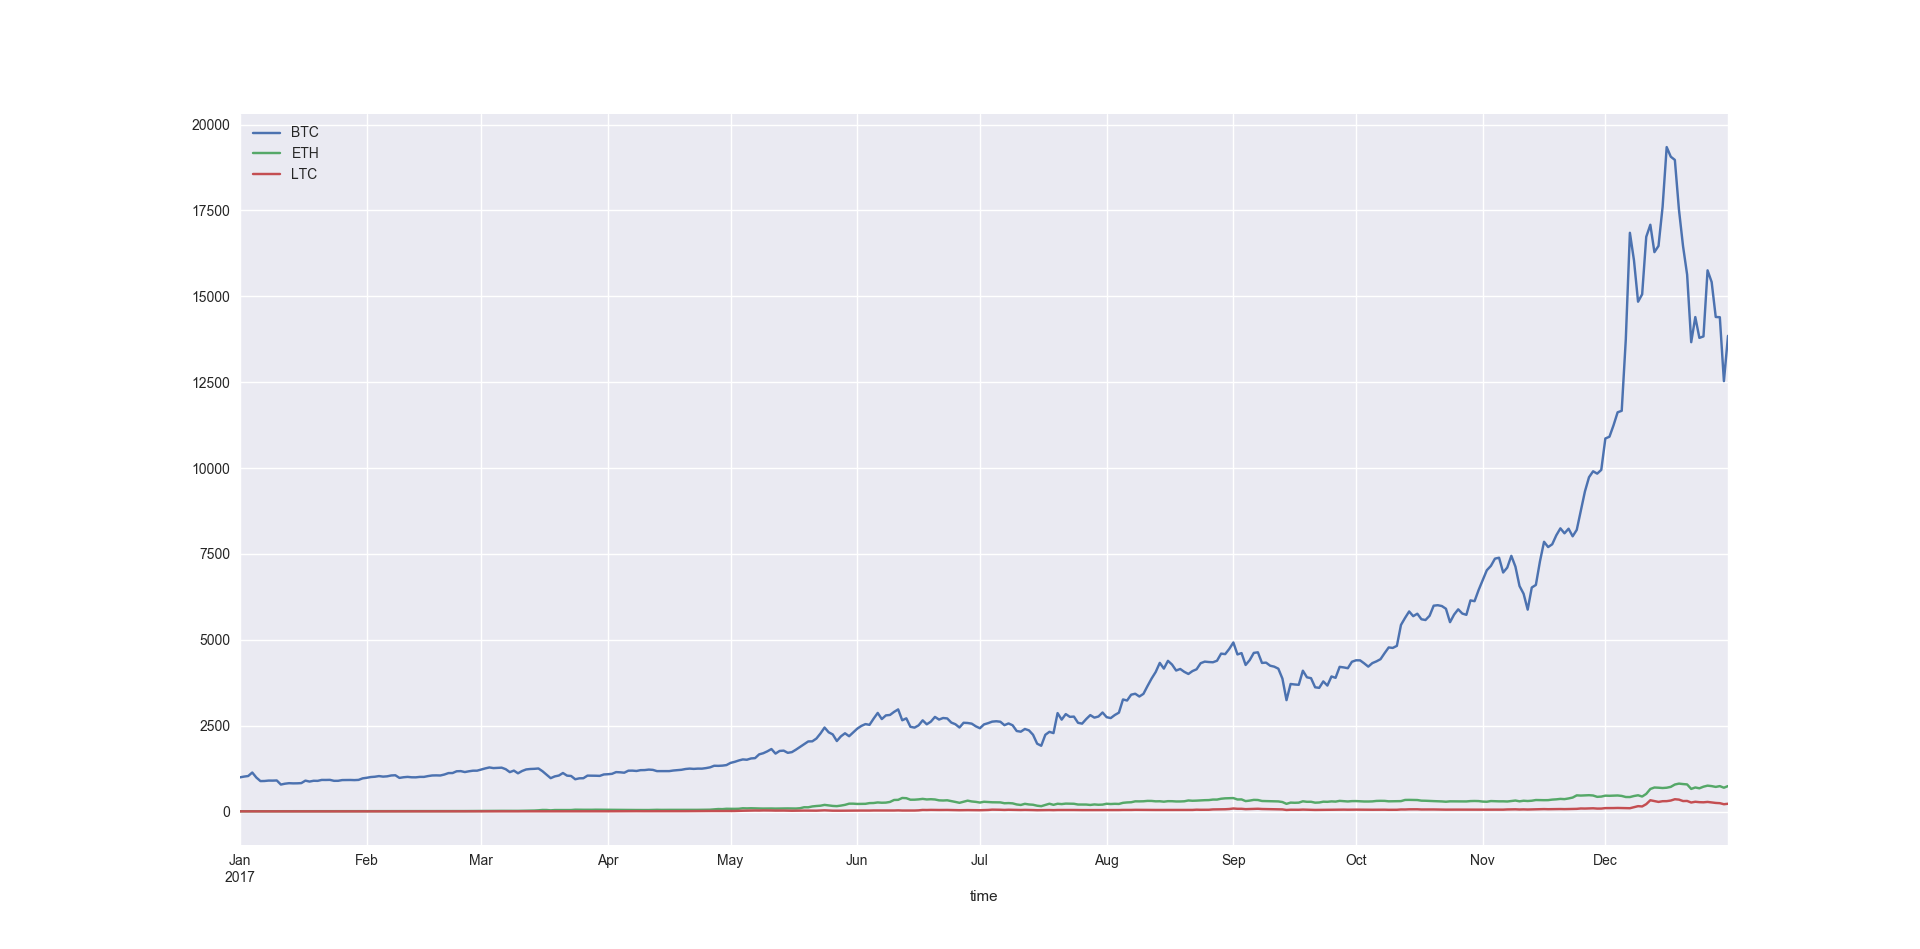
Plot some prices from 2017, an interesting year for cryptocurrency, to say the least:
# some cool stuff we can do with our data
import matplotlib.pyplot as plt
import seaborn as sns
# plot some prices
closes.loc['2017', ['BTC', 'ETH', 'LTC']].plot()
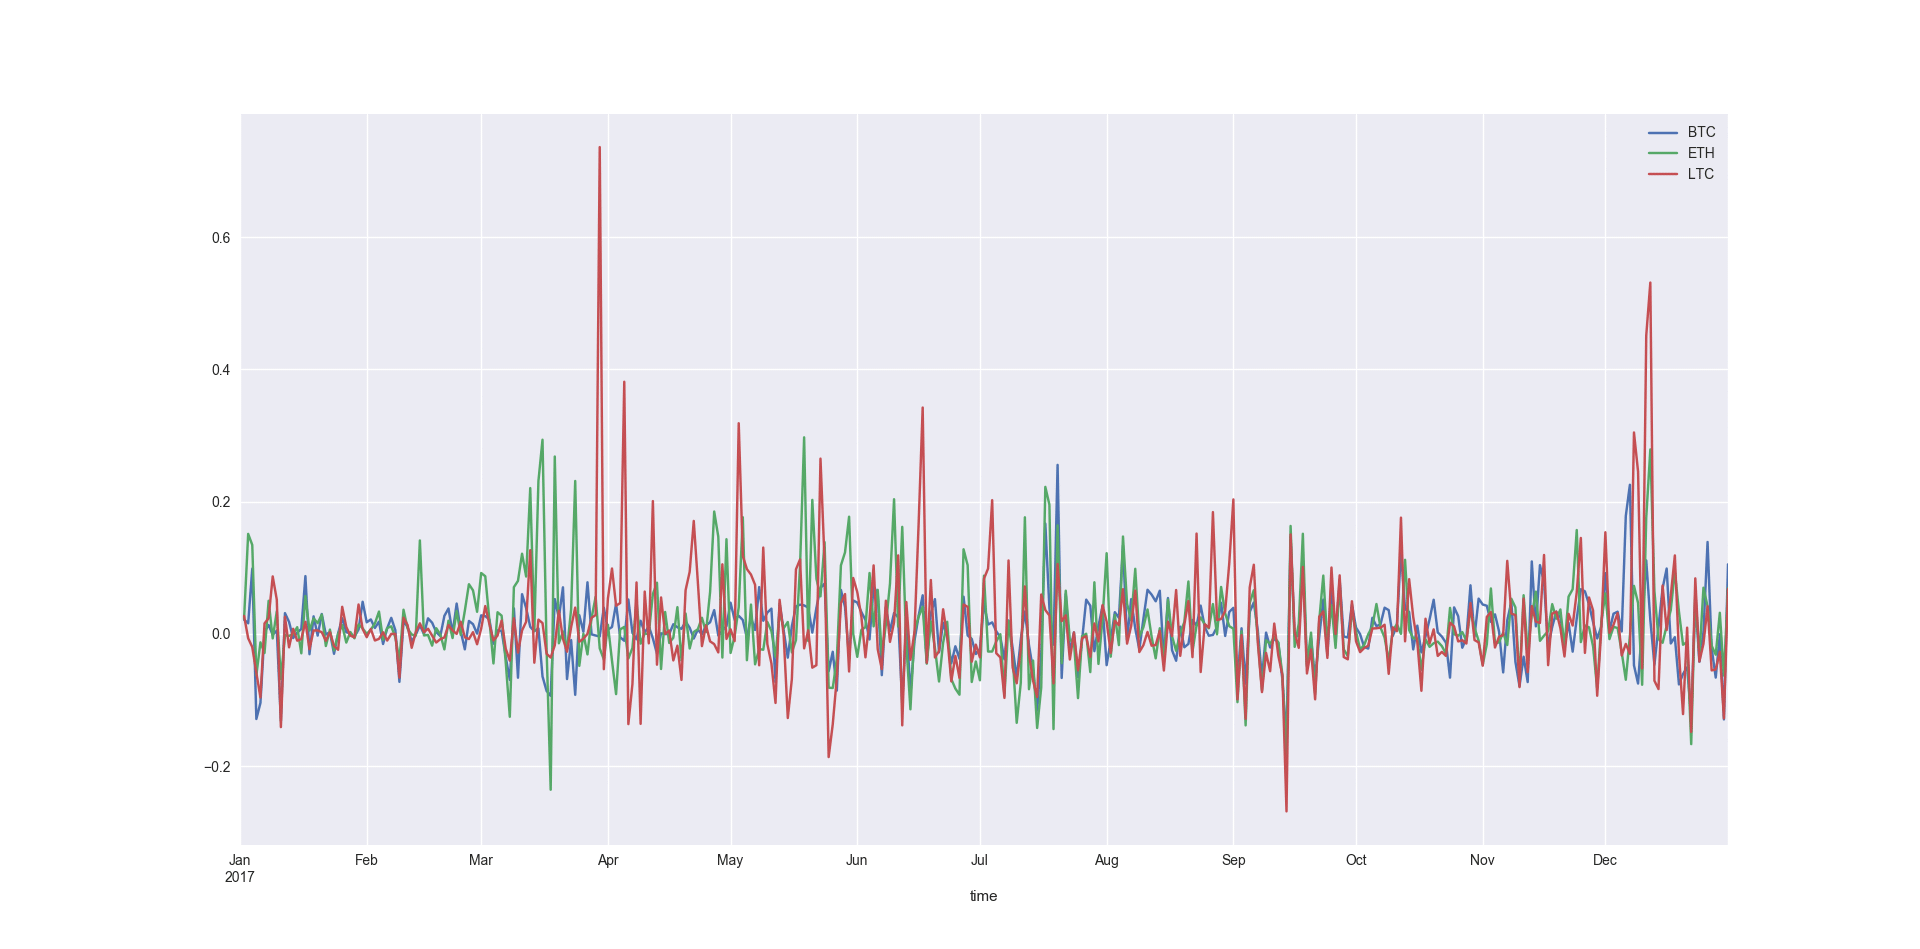
 Plot some returns series from the same period:
# plot some returns
closes.loc['2017', ['BTC', 'ETH', 'LTC']].pct_change().plot()
# plot correlation matrx
sns.heatmap(closes.loc['2017', ['BTC', 'ETH', 'LTC', 'XRP', 'XUC', 'BCH', 'EOS', 'VERI', 'TRX',]].pct_change().corr())

And finally, a scatterplot matrix showing distributions on the diagonal:
# scatter plot matrix
sns.pairplot(closes.loc['2018', ['BTC', 'ETH', 'XRP', 'VERI', 'LTC']].pct_change().dropna())

There’s lots more interesting analysis you can do with data from Cryptocompare, before we even do any backtesting, for example:
- Value of BTC and other major coins traded through the biggest exchanges over time – which exchanges are dominating?
- Top coins traded by fiat currency – do some fiats gravitate towards certain cryptocurrencies?
- Are prices significantly different at the same time across exchanges – that is, are arbitrage opportunities present?1
Conclusion
In this post, I introduced the Cryptocompare API and some convenient Python tools for interacting with it. I also alluded to the depth and breadth of data available: over 2,000 coins, some going back several years, broken down by exchange and even counter-currency. I also showed you some convenient base-Python and pandas data structures for managing and interrogating all that data. In future blog posts, we’ll use this data to backtest some crypto trading strategies.
*Data is the basis of everything we do as quant traders. Inside the Robot Wealth community, we show our members how to use this and other data for trading systems research in a way that goes much deeper than the basics we touched on here. But data is just one of the many algorithmic trading fundamentals we cover inside Class to Quant. Not only are our members improving their trading performance with our beginner to advanced courses, but together they’re building functioning strategies inside our community as part of our Algo Laboratory projects. If you’re interested and want to find out more, try Class to Quant for 30 days risk free. I’d love to meet you inside.


awesome