
 One of the very useful aspects of this sort of analysis is that it serves to temper the expectation associated with taking a strategy live. Personally, I know that after all the research and development that goes into developing a strategy, it is all too easy to let oneself think that the money will just roll in as soon as you go live. This approach brings the developer back to reality in terms of profit expectations, but it will also provide the confidence to continue trading while you should. In short, it brings objectivity to the forefront, which of course is a cornerstone of any statistical or quantitative approach to the markets.
I like jcl’s Cold Blood Index a lot. In a nutshell, it describes the similarity of a current drawdown to the backtest drawdown profile by examining multiple windows of the backtest balance curve, with each window equal in length to the length of the drawdown of interest (probably the current drawdown if trading live, but this approach is also useful for considering hypothetical drawdowns prior to going live).
The Cold Blood Index is more meaningful than the approach I used, but it does suffer from a similar drawback – being a function of the balance curve in the backtest. If you accept that the balance curve obtained in the backtest is one possible outcome amongst an infinite number of possibilities due to the random nature of individual trade results, then the result obtained with the Cold Blood Index is likewise one possible outcome amongst many.
(As an aside, this condition can be validated by examining the autocorrelation of the backtest returns series with various lags using either Zorro, R or some other statistical tool. Nearly every strategy I’ve experimented with, and definitely the ones that I’ve taken live, have all shown statistically insignificant return autocorrelations).
The Cold Blood Index could be improved by incorporating the algorithm into a Monte Carlo routine that creates many unique balance curves by randomly sampling the backtested trade results, and running it separately on each curve. I was fortunate enough to receive advice from jcl on how to accomplish this using Zorro, and my implementation is reproduced below. Most of the code is jcl’s, I have simply added the loop in which the balance curve is shuffled before being subject to jcl’s Cold Blood Index algorithm. I also added code to store the Cold Blood Index value generated in each loop iteration in an array and to calculate the 5th and 95th percentile values.
One of the very useful aspects of this sort of analysis is that it serves to temper the expectation associated with taking a strategy live. Personally, I know that after all the research and development that goes into developing a strategy, it is all too easy to let oneself think that the money will just roll in as soon as you go live. This approach brings the developer back to reality in terms of profit expectations, but it will also provide the confidence to continue trading while you should. In short, it brings objectivity to the forefront, which of course is a cornerstone of any statistical or quantitative approach to the markets.
I like jcl’s Cold Blood Index a lot. In a nutshell, it describes the similarity of a current drawdown to the backtest drawdown profile by examining multiple windows of the backtest balance curve, with each window equal in length to the length of the drawdown of interest (probably the current drawdown if trading live, but this approach is also useful for considering hypothetical drawdowns prior to going live).
The Cold Blood Index is more meaningful than the approach I used, but it does suffer from a similar drawback – being a function of the balance curve in the backtest. If you accept that the balance curve obtained in the backtest is one possible outcome amongst an infinite number of possibilities due to the random nature of individual trade results, then the result obtained with the Cold Blood Index is likewise one possible outcome amongst many.
(As an aside, this condition can be validated by examining the autocorrelation of the backtest returns series with various lags using either Zorro, R or some other statistical tool. Nearly every strategy I’ve experimented with, and definitely the ones that I’ve taken live, have all shown statistically insignificant return autocorrelations).
The Cold Blood Index could be improved by incorporating the algorithm into a Monte Carlo routine that creates many unique balance curves by randomly sampling the backtested trade results, and running it separately on each curve. I was fortunate enough to receive advice from jcl on how to accomplish this using Zorro, and my implementation is reproduced below. Most of the code is jcl’s, I have simply added the loop in which the balance curve is shuffled before being subject to jcl’s Cold Blood Index algorithm. I also added code to store the Cold Blood Index value generated in each loop iteration in an array and to calculate the 5th and 95th percentile values.
int TradeDays = 12;    // t, Days since live start
int DrawDownDays = 12; // l, Days since you're in drawdown
var DrawDown = 55;    // D, Current drawdown depth in $
string BalanceFile = "Log\\balancecurve.txt"; // stored double array
var logsum(int n)
{
    if(n <= 1) return 0;
    return log(n)+logsum(n-1);
}
void main()
{
    int CurveLength = file_length(BalanceFile)/sizeof(var);
    var *Balances = file_content(BalanceFile);
    var P_array[5000];
    //  var curve = Balances;
    int k = 0;
    for (; k < 4000; k++)
    {
        var randomBalances[3000];
        randomize(BOOTSTRAP, randomBalances, Balances, CurveLength);
        int M = CurveLength - DrawDownDays + 1;
        int T = TradeDays - DrawDownDays + 1;
        if(T < 1 || M <= T) {
            printf("Not enough samples!");
            return;
        }
        var GMin=0., N=0.;
        int i=0;
        for(; i < M; i++)
        {
            var G = randomBalances[i+DrawDownDays-1] - randomBalances[i];
            if(G <= -DrawDown) N += 1.;
            if(G < GMin) GMin = G;
        }
        var P;
        if(TradeDays > DrawDownDays)
        P = 1. - exp(logsum(M-N)+logsum(M-T)-logsum(M)-logsum(M-N-T));
        else
        P = N/M;
        printf("\nTest period: %i days",CurveLength);
        printf("\nWorst test drawdown: %.f",-GMin);
        printf("\nM: %i N: %i T: %i",M,(int)N,T);
        printf("\nCold Blood Index: %.1f%%",100*P);
        P_array[k] = P;
    }
    var fifth_perc = Percentile(P_array, k, 5);
    var ninetyfifth_perc = Percentile(P_array, k, 95);
    printf("\n5th percentile CBI: %.1f%%",100*fifth_perc);
    printf("\n95th percentile CBI: %.1f%%",100*ninetyfifth_perc);
}
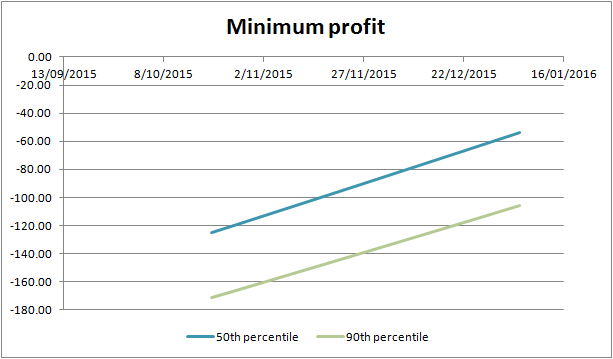
To compare methods for pulling out of a strategy, I looked at the results obtained from my original method (Method 1), the Cold Blood Index calculated from the backtest balance curve (one-sample Cold Blood) and the 5th percentile Cold Blood Index calculated from 4,000 randomly sampled balance curves (resampled Cold Blood). These results are for a drawdown of 55 days duration that started immediately upon strategy initiation (these results are for a real strategy that I am currently trading live. 55 days equates to a trading time that extends to the end of the year from the date that I initiated it. I am curious to investigate what sort of drawdown I should endure at the end of the year).
| Drawdown($) | Method 1 %ile | One-sample Cold Blood | 5th%ile Resampled Cold Blood |
| -60.18 | 50 | 6.8 | 5 |
| -68.79 | 60 | 5.5 | 4 |
| -76.28 | 70 | 4.9 | 3.5 |
| -92.00 | 80 | 3 | 2.3 |
| -111.85 | 90 | 1 | 1 |
| -202.08 | 100 | 0 | 0 |
Conclusions
- If we are committed to a quantitative approach to trading, an objective measure of strategy performance is required in order to decide whether to pull out or continue through a drawdown.
- The Cold Blood Index is a significant improvement over existing techniques such as modelling acceptable drawdown as a function of backtest performance measures.
- The resampled Cold Blood Index provides additional accuracy by considering the random nature of individual trade results and empirically estimating its true value from a large number of samples. This method would break down in the case of serially correlated returns, but otherwise has the potential to preserve more of the trader’s capital than other methods.
Free Case Study:
A wantaway engineer’s journey into professional trading and out again
I went from engineering to an equity partnership at a prop trading firm to running my own systematic trading operation from home in Western Australia.
This case study is the full story – every mistake, every breakthrough, and some things I trade today.


awesome work!
I was wondering it the cold blood Index could be used as well in the backtest somehow. I mean, some part of the data is used for backtesting and the last part of it is used as “live trading” . In that way the cold blood Index would check the balance curve of the backtest until that point that we consider the backtest as live trading.
The point would be reduce the DD. It could be used as equity curve trading. It is just an idea, not sure if this make sense at all since the CBI is trying to tell us if the strategy is working in real trading. And in this case it would be used to improve the strategy
Hey Mariano, thanks for reading!
I think you could use the CBI in your backtest. The application that springs to mind is to apply it to your out of sample test and compare the results with the in-sample test. Ideally you would see some level of stability in the CBI across the training and test sets if your model wasn’t over-fit. Some level of degradation is probably unavoidable, but a model that is neither under-fit nor over-fit would show comparable results. Of course, degradation could also be a result of the strategy simply expiring during your out of sample test. Either way, it would be a sign that the strategy wasn’t quite ready to go live.
Of course there are numerous other performance metrics to compare across the training and test set results, but I see no reason why the CBI shouldn’t be added to the mix. The additional insight gained would be valuable.
I see it more clear now. Thanks for the nice explanation and congratulations for the blog!
I´ll look forward to read more of your researchs.