
This article continues our recent articles on stat arb:
- A short take on stat arb trading in the real world
- A general approach for exploiting stat arb alphas
In this article, I’ll brainstorm some ideas for predictive features that you could potentially use in a crypto stat arb model.
The ideas draw insights from recent discussions and market observations, but of course, you should do your own research.
In future articles, I’ll pick some of these features and seek to quantify and combine them, and finally demonstrate how to navigate the return-risk trade-offs using heuristics and explicit optimisation.
But first, let’s brainstorm some ideas.
Understanding Relative Movements
The classic stat arb approach capitalises on relative movements between similar assets.
In particular, fading price-insensitive buying or selling that pushes an asset’s price away from fair value tends to be a good bet.
Trend Effects and Momentum
Apart from relative movements, identifying predictable short-term and long-term trend effects can be useful, particularly in less efficient markets.
An interesting example is the concept of crowded spreads breaking. When many traders occupy a spread, and it diverges further and further, it can lead to violent momentum as everyone gets forced out of it.
If you’re skilled, you can build these effects into your stat arb models.
Lead-Lag Relationships
The crypto market sometimes exhibits specific lead-lag relationships, where the price movement of one asset is predicted by the movement of another.
An interesting example was the lead-lag relationship between Bitcoin and the S&P 500.
I don’t know if this still exists, but when I last looked in 2022, it was observable in the data.
If you look at the intraday correlations of those things, you’ll see that what probably happened was that someone put SPX returns into their market-making fair value algorithm, which ended up creating a structural lead-lag correlation effect between these two assets.
You can imagine that if you’ve got people moving quotes on the basis of recent moves in some asset, then you’ve effectively physically generated a lead-lag relationship between those things – because a big part of price movement is quote revision.
Volume and Price Movement
Another important idea, especially in less liquid markets, is understanding the volume required to move price.
By analyzing the relationship between the historical volume of aggressive buying or selling and the resultant price change, you may be able to infer the presence of invisible supply or demand.
For example, you might look at the historical data and find that, on average, $100k of aggressive buying over the last minute created a price change of 0.2% (those numbers don’t mean anything; they’re just to make the example more real).
Now, imagine you see $1 million of aggressive buying, and it only moves price 0.2% over the next minute. That would suggest that there is an invisible supply in the market that’s being reloaded as an iceberg order or similar.
All things being equal, you’d rather fade that move – because unless more demand comes in, you infer that there’s an imbalance.
On the other hand, we did some analysis back in 2022 that suggested that, on average, crypto price moves on larger volumes were more likely to continue.
Often, these trend/reversion effects play out over different time horizons, and how you incorporate them into your model requires some careful analysis.
Carry
Carry is also very interesting in crypto.
You would naively expect that futures trading at a premium to spot are, on average, more likely to go down, while those trading at a discount tend to go up.
However, when we looked at carry in crypto, we found that total returns (price change plus funding) were correlated with the futures premium, with some potentially interesting and different dynamics in the tails.
So, carry is potentially an interesting feature to include in your crypto stat arb models.
In addition, changes in carry might be worth looking at.
For example, say you’re looking at a certain crypto spot market and its perpetual contract. The perpetual gets bid up 1%. You go and check what’s happened in the spot market. You’d probably think differently about the continuation of that move if the spot hadn’t moved than if they’d both been bid up together.
Seasonal Patterns
Lastly, seasonal patterns can be interesting, especially in less liquid assets. These can be due to cultural factors or known trading activities like rebalance trades. These patterns can be useful inputs to stat arb models.
Conclusion
In this article, we brainstormed some potential predictive features for a crypto stat arb model.
We came up with:
- Relative price moves
- Predictable trend effects
- Lead-lag relationships
- Volume and price change
- Carry
- Seasonal patterns
The next step would be to do some data analysis that attempts to understand these features in detail, ideally quantifying their historical strength and decay characteristics. We’ll tackle this in a future article.
Free Case Study:
A wantaway engineer’s journey into professional trading and out again
I went from engineering to an equity partnership at a prop trading firm to running my own systematic trading operation from home in Western Australia.
This case study is the full story – every mistake, every breakthrough, and some things I trade today.


Interesting. May I know what are the tools you apply on the data that is transformed to information. For instance, I am interested to understand what tools you use on the data to find statistical arbitrage opportunity
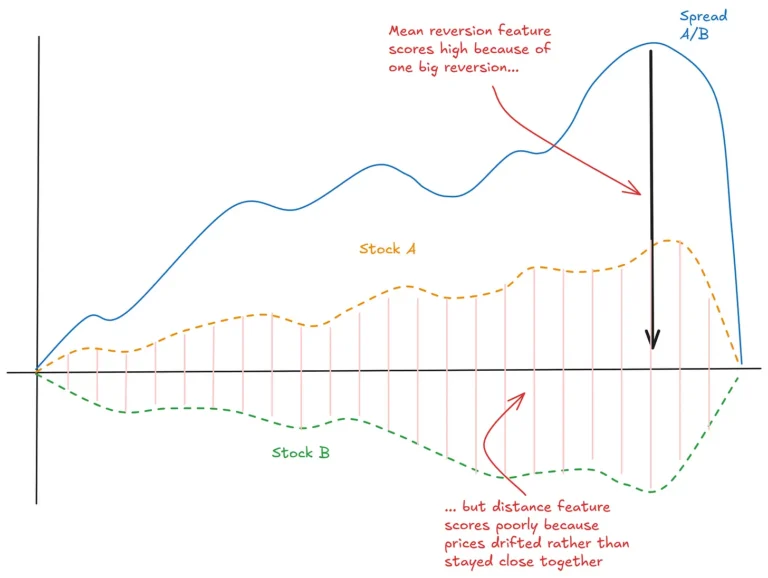
Good question. Let’s talk equity pairs to start with. Our equity pairs approach focuses on identifying pairs that we think are likely to see divergence and convergence. Identifying a good pairs universe is pretty much the whole game… then its just a matter of trading the divergences and convergences and managing your risk.
We do this universe selection a little differently to what you see in most stat arb articles/papers/etc, which tend to use things like cointegration tests. We like to look a little more directly at the effect – which fundamentally is just pairs of assets diverging and converging. For equities, our approach is to create features that directly quantify this effect for pairs of assets. We run these over a broad universe of pairs. Since there are loads of pairwise combinations, you can imagine that this takes quite a lot of compute resources. But the problem as farily tractable with big data and cloud tools such as Big Query. In addition to directly looking at convergence/divergence, we also apply some simple filters that sanity check that a particular pair of assets might indeed by exposed to similar risk factors. Finally, we also look at pairwise partial correlations via the graphical lasso as a final filter.
For the more general long-short crypto stat arb stuff that I mentioned in the article, it’s mostly a matter of quantifying the relationship between the feature and future (relative) returns. Nothing complex – just simple data analysis will do (scatterplots, correleations, etc). I’ll do a follow up article with an example.