
If you have some factor that you think predicts future stock returns (or similar) and you are making charts like below, then here are some tips…
 We’ll go through an example of trying to “time” SPX with the level of VIX.
You get daily SPX index prices and daily VIX close data
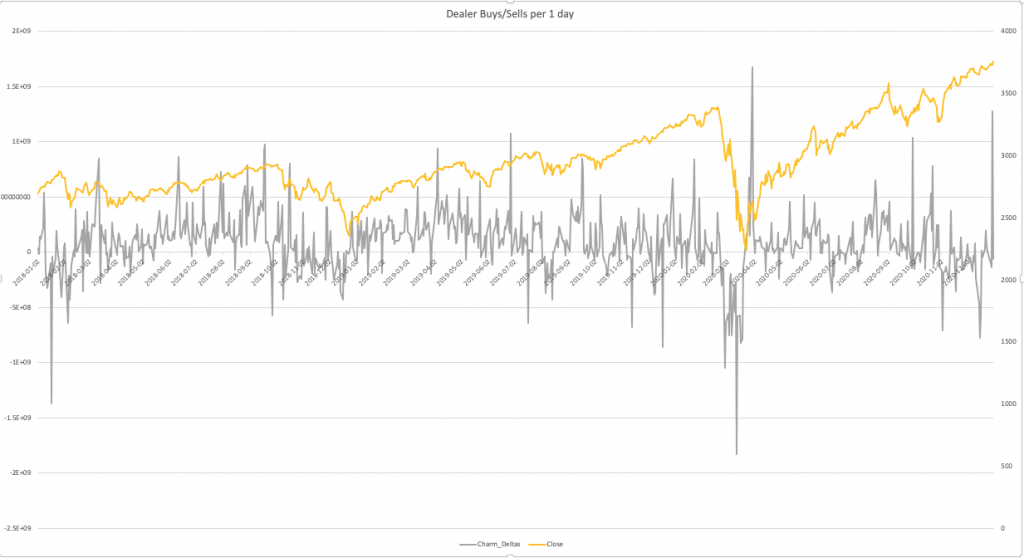
You align them by date and plot them on dual axes, in true RealVision style.
“SPX tends to go down when VIX is high. I can therefore time an SPX allocation based on VIX. Let me share this on twitter” you say.
No. Very no.

There are two main problems with what you did:
- The SPX price drifts. We can’t directly compare the price of SPX in 2004 with its price in 2021
- As traders, we are more interested in whether high VIX is followed by decreasing SPX prices, not coincident with them.
We’ll deal with them in order.
Dealing with Non-Stationarity
First, you almost never want to be analyzing asset prices, because asset prices tend to be highly “non-stationary”. We can’t compare them across our sample. SPX 1000 in 2015 is not comparable to SPX 1000 in 2021 (which would be more significant)
Plotting prices is maybe how you’re used to looking at stock charts, but it’s no way to do data analysis.
If I presented something like this to my old boss he’d throw it back in my face and say:
“James, I need at least a modicum of f***ing stationarity!”

He’d then elaborate on my worth as a researcher (and human being) in ways that might appear problematic in the 2021 workplace.
But it was ultimately very helpful.
I hope you can benefit from this advice, even if you don’t have a boss like that…
So how do we get him his “modicum of stationarity”?
An easy and effective way is to look at differences in prices (or returns) rather than prices themselves
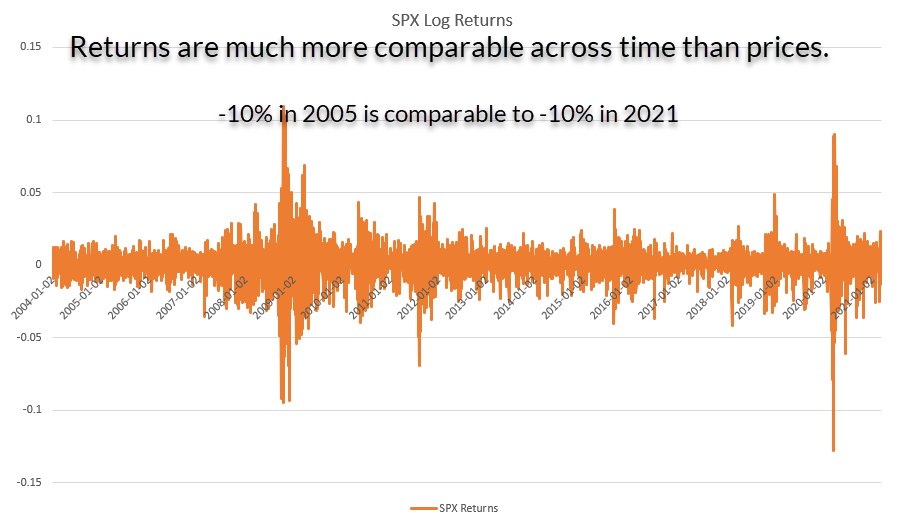
In this case, we’re going to look at daily log returns.

We see that returns are much more “stable” and comparable over time.
10% in 2005 is comparable to 10% in 2021.
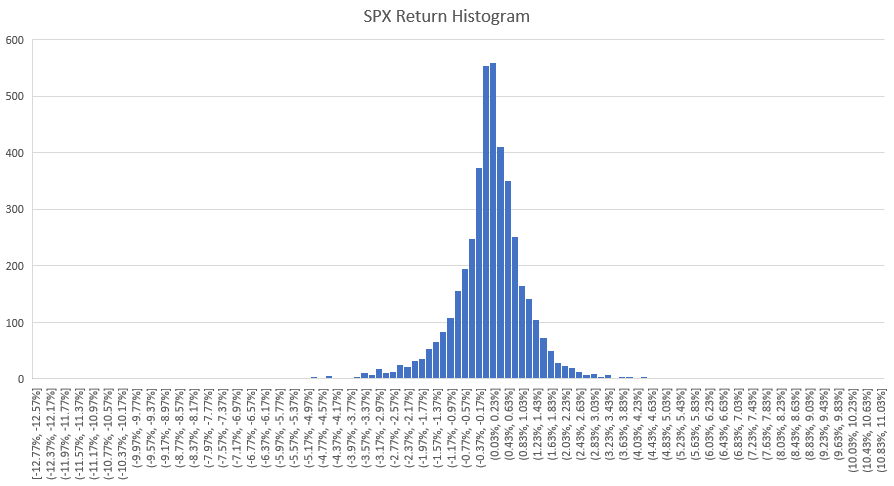
If we plot returns as a histogram, we get the familiar “bell-shaped” distribution, with a high peak, positive mean, negative skew, and fat tails.
Always plot everything, by the way!

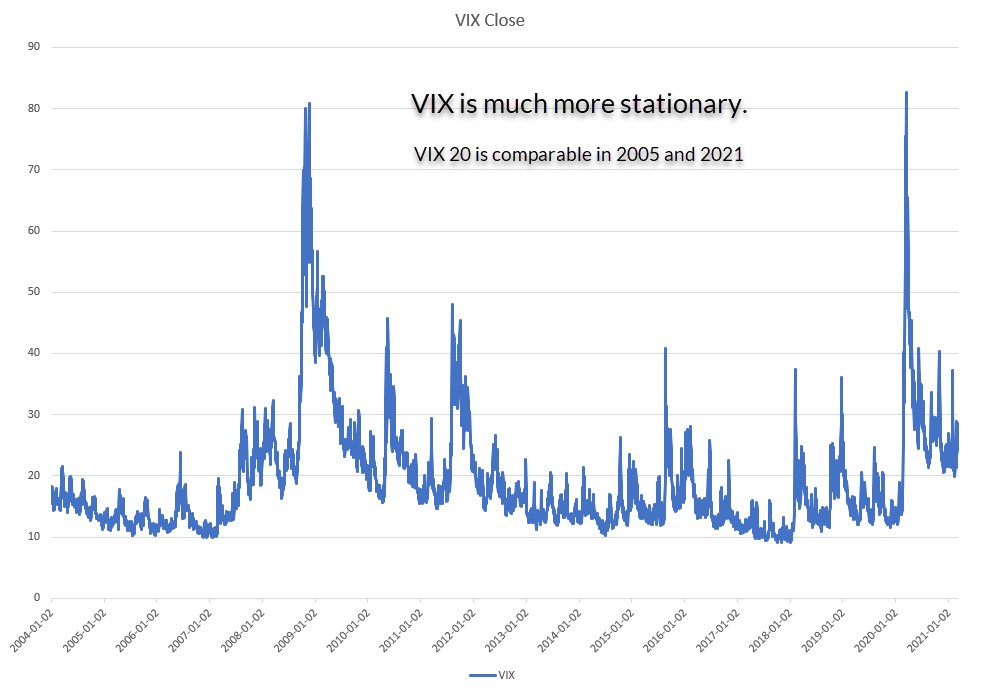
Now let’s turn our mind to the VIX series…
VIX is much better behaved. VIX 20 is comparable in 2005 and 2021.
The histogram of VIX values shows it to be positively skewed (occasionally we observe very large values). This is also evident from the spikes in the chart.

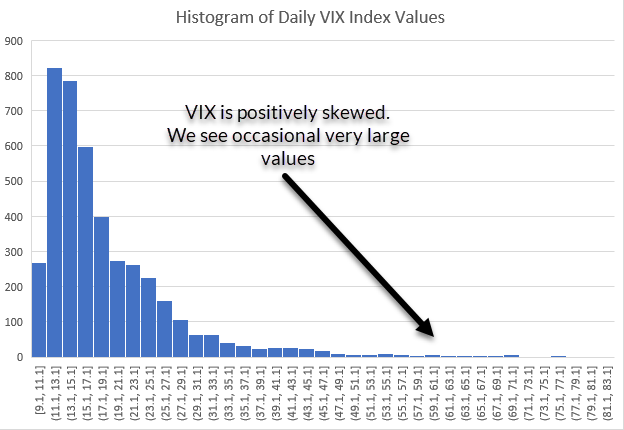
So we’ll leave VIX alone for now, and confront the next point.
Looking for a Predictive Relationship
“Do SPX returns tend to be lower on days when the VIX closes at a high value?”
You can probably tell by the way I’ve phrased the question, that I think this question is a bit dumb, but let’s soldier on…
We plot a scatterplot of SPX returns against the VIX level at the end of the day.
We see a weak negative relationship.
On days when the VIX closed high, we saw lower returns, on average.
Means we might be onto something, right?
Wrong.

Your job as a researcher is to call bullsh*t on everything.
“What, other than the thing I hope is true, could be causing this?” Call yourself on your bullsh*t before someone else does. But first, what else do you notice about that plot?
You should notice that the scatterplot is “noisier” and returns are more spread out for higher values of VIX.
This is because:
– we have fewer observations for very VIX
– by definition, the spread of returns is higher when volatility (VIX) is higher

We don’t have to do anything about this, other than understand it… but we can.
We can normalize our returns by their expected volatility by dividing our SPX returns by the previous day’s VIX value
Now our scatterplot looks like this (we’ve controlled for that obvious effect)

So what’s causing this – other than VIX having magic SPX direction predicting powers?
We’re looking at the relationship between SPX returns and the VIX level *at the end of that period*.
We’re looking at a coincident relationship.
If we know anything about equity index volatility, we know that volatility expectations will tend to increase when the SPX goes down.
So it’s likely this is what we’re seeing here.
Let’s quantify it.
Here we plot SPX returns against the change in VIX in % points over the same period.
We see a very clear negative relationship. On days when SPX goes down, VIX tends to go up (and vice versa).
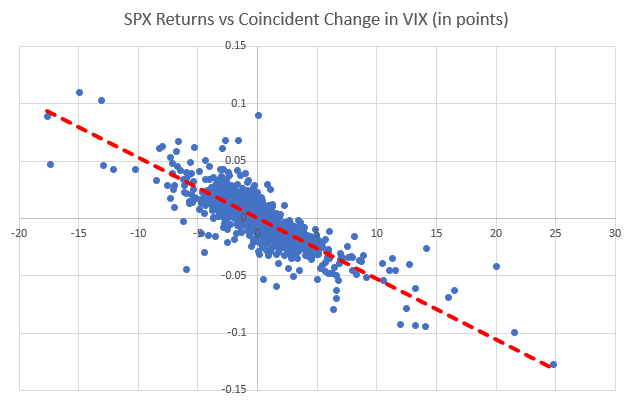
So, to what extent is this causing the effect we saw?
We can control for this by asking a better question:
“Do next day SPX returns tend to be lower, following a high VIX reading the previous day?”We’re now starting to deal with our second problem – the coincidence thing…
So we plot vol-normalized SPX returns against the value the VIX index value at *the previous day*.
This represents something we could almost do in the market.
(We can’t in reality because the VIX daily marking was, until very recently, 15 minutes after the SPX close.)

Even though we’ve made some flattering assumptions about being able to see 15 minutes into the future, there’s little evidence pointing at a significant relationship between the VIX level and next-day SPX returns.
This shouldn’t be a surprise. The market is dominated by noise.
We’re dealing with daily data here. A scatterplot of returns vs factor is always going to be a tough ask at this scale, even for the most venerable of anomalies.
But I wanted to demonstrate that what seems like a clear predictive relationship if you’re looking at it sloppily, starts to look like a mass of randomness when you analyze it more carefully.
Takeaways?
- “Give me a modicum of f’ing stationarity” – prefer to work with returns rather than prices
- Define clearly the question you’re asking of the data
- Plot everything
- Don’t bullshit yourself… search hard for reasons outside of your pet theory.
Free Case Study:
A wantaway engineer’s journey into professional trading and out again
I went from engineering to an equity partnership at a prop trading firm to running my own systematic trading operation from home in Western Australia.
This case study is the full story – every mistake, every breakthrough, and some things I trade today.


