Important preface:
This post is in no way intended to showcase a particular trading strategy. It is purely to share and demonstrate the use of the framework I’ve put together to speed the research and development process for a particular type of trading strategy. Comments and critiques regarding the framework and the methodology used are most welcome. Backtest results presented are for illustrating the methodology and describing the outputs only.
That done, on to the interesting stuff
My last two posts (Part 1 here and Part 2 here) explored applying the k-means clustering algorithm for unsupervised discovery of candlestick patterns. The results were interesting enough (to me at least) to justify further research in this domain, but nothing presented thus far would be of much use in a standalone trading system. There are many possible directions in which this research could go. Some ideas that could be worth pursuing include:
- Providing the clustering algorithm with other data, such as trend or volatility information;
- Extending the search to include two- and three-day patterns;
- Varying the number of clusters;
- Searching across markets and asset classes;
- Considering intra-day patterns;
- Others have suggested the application of a Markov Chain Monte Carlo model in order to build a predictive model based on joint probability tables;
- Reader Sven had an interesting idea which he described in the comments on my last post: stacking the k-means algorithm with a supervised learner such that k-means provides an element of feature engineering for the supervised learner.
These ideas are broad and would require significant research effort. Also, they only scratch the surface of what might be possible; I’m certain that there are many more applications that deserve attention. This leads me to the conclusion that it would be worth spending some effort creating a framework that enables rapid prototyping of different ideas. For such a framework to have any practical value, it would need to also be robust enough to enable statistically valid conclusions to be drawn.
I decided that Zorro’s efficient and robust strategy development environment combined with the machine learning capabilities of several R packages would make a neat solution. For anyone who has not used Zorro, it uses a simple, C-based syntax and many trading and backtesting functions are implemented with only a few lines of code. Zorro makes it relatively easy to test many ideas quickly.
In order to make the framework as robust as possible, I decided to incorporate walk-forward analysis and to include transaction costs at all stages of development. Of course, walk-forward analysis is not a panacea for eliminating bias and is easy enough to abuse. For example, by walking-forward many potential strategies and selecting the best out of sample performer, selection bias has been introduced. It is up to the developer to be aware of such issues and to account for them in the design process. For example, holding out some data as a final test set for an unbiased estimate of performance as a final step, or running White’s reality check (although both of these approaches have their own drawbacks, the former being constrained by data availability and the latter requiring that a running count of all ideas tested by both man and machine be kept).
Framework overview
In this section I’ll describe the functioning of the framework and give a simple example. Following that, I’ll demonstrate that it is a simple matter to extend the analysis by increasing the dimensionality of the data supplied to the k-means algorithm and adding other markets to the analysis.
This should be considered a beta version of the framework and there are many ways it could be improved or expanded. I’ve made the full source code available below and anyone interested can modify it as they see fit.
The framework can be run in two modes: single model mode and walk-forward mode. Each mode has a number of sub-routines that need to be run in the correct order. Script run control is via a series of #ifdef statements and the user supplies most of the key parameters at the outset. The data used in the clustering algorithm needs to be manually entered in the correct places and some effort is required to ensure consistency between runs within the same mode. This could be automated with a little more effort.
Single-model mode consists of two modules (DATAEXPORT and RUNSINGLE) and is used to export relevant data from Zorro to R and build and test a k-means clustering model on the entire data set. There is no built-in walk forward function for this mode, however the user can specify an out of sample test by modifying the start and end dates within the DATAEXPORT and RUNSINGLE routines. DATAEXPORT needs to be run first as its outputs are required for the RUNSINGLE routine.
The walk-forward framework is premised on the idea of creating a dynamic classification model based on the most recent market data and updated at regular intervals, hypothetically accounting for market changes over time. The walk forward framework is based on splitting the historical data set into several smaller training sets. A model is built on the first training set and then tested on the out of sample data immediately following the training period. The training window is then ‘walked forward’ and a new model built on that new training set and then tested on the next out of sample test set. The process is repeated until the training window has covered the entire data set. Final performance is reported as the sum of all the out of sample tests. I won’t go into a detailed exposition of walk-forward analysis, its benefits and pitfalls in this post as there is plenty of good information that a quick internet search will reveal. See this for example. One aspect of walk forward analysis that I particularly like is the ability of the rolling window to capture and test ephemeral market inefficiencies which can tend to get swallowed up and go undetected in broader studies.
Walk-forward mode consists of four routines (WFOSETUP, WFOCLASSIFY, WFOTRAIN and WFOTEST) that need to be run in sequential order. WFOSETUP must remain uncommented when running any of the other three walk forward routines, as it contains the parameters that need to be calculated for the walk-forward analysis to run correctly. WFOCLASSIFY builds a k-means model for each of the training sets and saves them to disk.
WFOTRAIN tests a trading strategy based on each k-means model on the training set upon which it was built. By default, the WFOTRAIN routine is set up to test a one day ahead system in both long and short directions for each training set for each cluster, but this can be changed as required. The performance of each strategy is saved to disk. By default, the performance metric recorded is profit factor, although this can also be customized. If WFOTRAIN is working as expected, the final result of the Zorro run should be a steadily declining equity curve with a profit factor slightly less than 1. This is because a one-bar trade is being opened in each direction every bar, and therefore the final loss of this test run should be equal to the total transaction costs.
WFOTEST is designed to test the out of sample performance of selected strategies identified in the WFOTRAIN routine. The user specifies a threshold level of performance from the training set. The WFOTEST routine reads the saved performance metrics from disk and applies any strategy whose in sample performance was better than the threshold performance in an out of sample period. The overall results are the sum of the out of sample results for each separate strategy.
I’ll step through each routine by way of example and include the complete code at the end of the post.
A simple example
In this example, I will investigate using relationships between the open, high, low and close prices of a single instrument. Then I’ll see what is revealed by including multiple instruments in the clustering algorithm. Finally, I’ll modify the code to cluster on two-day candlestick patterns.
Preliminaries: Definition statements and user supplied variables
The code below includes the definition statements which control the blocks of code to be run in each routine. The user-supplied parameters are also listed. Note the while(asset(loop(…))) call. This is a Zorro-specific function that causes the script to loop through multiple assets. The user-supplied parameters control the number of clusters, the number of walk forward cycles and the proportion of data in each cycle assigned to the training and testing sets. This is also indirectly controlled by the start and end dates of the simulation, which is set inside the run() function.
//////////// (A) SINGLE MODELS - UNCOMMENT DESIRED FUNCTION
#define DATAEXPORT // exports data to R and builds single classification model
//#define RUNSINGLE // runs a single cluster strategy test based on defined trading parameters and k-menas model built by DATAEXPORT
//////////// (B) ROLLING WALK FORWARD FRAMEWORK - UNCOMMENT DESIRED FUNCTIONS
//#define WFOSETUP // WFO paramters - this must be defined for all WFO routines defined below (ie leave uncommented)
//#define WFOCLASSIFY // builds a series of models for use in WFO test. requires WFOSETUP be uncommented
//#define WFOTRAIN // runs a series of cluster strategies on in-sample data and saves results to file. requires WFOSETUP be uncommented and WFOCLASSIFY previously run
//#define WFOTEST  // runs a walk forward out of sample test using models selected by wfoTrain routine. requires WFOSETUP be uncommented and WFOCLASSIFY and WFOTRAIN be previously run
//////////// USER-CONTROLLED VARIABLES
#define ASSETLOOP while(asset(loop("EUR/JPY"))) // asset loop for wfo test
int numAssets = 1; // user input required to match number of assets in asset loop
int cycles = 8; //number of test/train cycles
var testProp = 0.75; //proportion of data per cycle to be assigned to test set
int numClusters = 6; //set number of clusters to group candles into
static var PF[96]; // set array to dims [cycles * clusters * Assets * 2]
var threshold = 1.1; // profit factor threshold in training set to trade in out of sample test
Module 1: DATAEXPORT
This part of the framework exports the data of interest for a single instrument to a CSV file and builds a clustering model in R using the k-means algorithm. In order to normalize the data across markets, I’ll use the ratio of the high, low and close prices to the open (as opposed to the difference, which was used in the last post). Mind the file path in the code below.
...
function run() {
    BarPeriod = 1440;
    PlotWidth = 1200;
#ifdef DATAEXPORT // export historical data and build clustering model
    LookBack = 0;
    StartDate = 2008;
    EndDate = 2014;
    vars Open = series(priceOpen());
    vars High = series(priceHigh());
    vars Low = series(priceLow());
    vars Close = series(priceClose());
    var HO = High[0] / Open[0];
    var LO = Low[0] / Open[0];
    var CO = Close[0] / Open[0];
    char line[100];
    sprintf(line,
        "%1.5f, %1.5f, %1.5f\n",
        HO,LO,CO);
    if(is(INITRUN))
        file_delete("Data\\export.csv");
    else
        file_append("Data\\export.csv",line);
    if (is(EXITRUN)) {
        Rstart("Zorro_kmeans.r",2);
        if(!RCheck()) return;
        Rx("data <- read.csv('C:/FILEPATH/Zorro/Data/export.csv', header = FALSE)"); // mind the forward slashes and file path
        Rx("class_factors <- data[, 1:3] ");
        Rx("colnames(class_factors) <- c('HO', 'LO', 'CO')");
        Rset("num_clusters", numClusters);
        Rx("set.seed(123)"); // required in order to reproduce results
        Rx("fit <- kmeans(class_factors, num_clusters)");
        Rx("save(fit, file = 'C:/FILEPATH/Zorro/Data/kmeans_fit.rda')"); // save model for later use - generic naming convention
        }
#endif
...
Module 2: RUNSINGLE
This routine tests a strategy set up by the user on a price history also set up by the user. This can be customized to run a single out of sample test if the price history is set differently to the DATAEXPORT routine. The intent was to provide a fast and easy way to quickly gain some insights about certain strategy parameters and data used in the clustering algorithm. The user needs to ensure that the data created and sent to R is of the same type as that used in the DATAEXPORT module (that is, if relative high, low, close and open data was used to build the model, this same information is needed in order to classify new data). The example code below tests a one-day ahead strategy that shorts cluster three and goes long following cluster six (again, mind the file path):
...
#ifdef RUNSINGLE // run a single test using trade logic defined below
    LookBack = 1;
    StartDate = 2010;
    EndDate = 2015;
    int cluster;
    if(is(INITRUN)) {
        Rstart("Zorro_kmeans.r",2); // this file loads the libraries required in the analysis - hangs if they are not already installed
        Rx("load(file = 'C:/PATH/Zorro/Data/kmeans_fit.rda')");
        if(!RCheck()) return;
    }
    vars Open = series(priceOpen());
    vars High = series(priceHigh());
    vars Low = series(priceLow());
    vars Close = series(priceClose());
    if(!is(LOOKBACK)) {
        Rset("HO", HO);
        Rset("LO", LO);
        Rset("CO", CO); // the R variable names need to match the factors in the saved k-means model
        Rx("predict_data <- data.frame(HO, LO, CO)");
        cluster = Ri("predict.kmeans(fit, data = predict_data)");
        // trade logic
        ExitTime = 2; // trade time of one day
        if (cluster == 3) {
            enterShort();
        }
        else if (cluster == 6) {
            enterLong();
        }
    }
#endif
...
After running this routine, Zorro plots an equity curve and outputs some helpful trade statistics (truncated here):
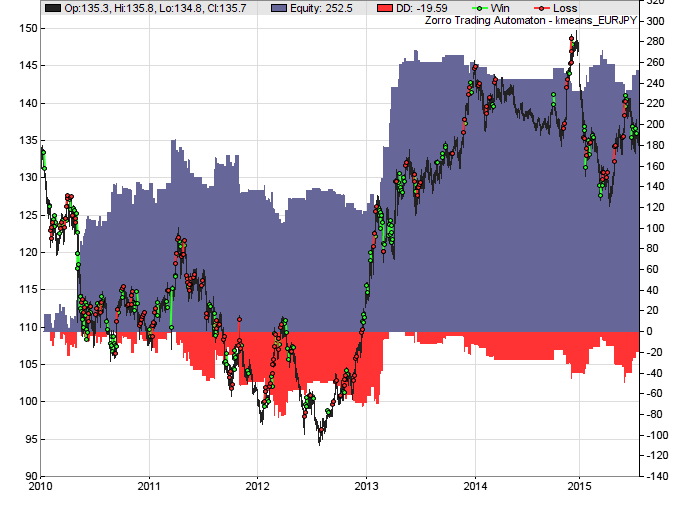
BackTest kmeans EUR/JPY
Gross win/loss      793$ / -540$ (+3121p)
Average profit      46$/year, 3.79$/month, 0.18$/day
Max drawdown        -83$ 33% (MAE -83$ 33%)
Transaction costs   -40$ spr, 2.89$ slp, -1.63$ rol
Capital required    66$
Number of trades    208 (38/year, 1/week, 1/day)
Percent winning     53%
Max win/loss        42$ / -28$
Avg trade profit    1.21$ 15.0p (+88.3p / -68.8p)
Avg trade bars      1 (+1 / -1)
Time in market      15%
Max open trades     1
Max loss streak     7 (uncorrelated 7)
Annual return       69%
Profit factor       1.47 (PRR 1.21)
Sharpe ratio        0.86
Portfolio analysis  OptF  ProF  Win/Loss  Wgt%
EUR/JPY             .038  1.47  111/97   100.0
EUR/JPY:L           .138  3.92    9/6     35.7
EUR/JPY:S           .029  1.32  102/91    64.3
Module 3: WFOSETUP
This module contains the parameters required to run the walk forward analysis, in addition to those supplied by the user at the outset. A start and end date of the simulation is specified here, and the script calculates several parameters related to the lengths of the test and train data sets for each cycle. This module must be included (that is, its definition statement must remain uncommented) when running any of the walk forward modules since the start and end dates, as well as the parameters relating to cycle length and data splits must be consistent between walk forward modules.
...
#ifdef WFOSETUP // set up WFO parameters
    StartDate = 2008;
    EndDate = 2015;
    var split = testProp/(1-testProp);
    var testBars = NumBars/(cycles + split);
    var trainBars = split*testBars;
//  printf("\ntestBars: %3.3f, trainBars: %3.3f\n", testBars, trainBars);
#endif
...
Module 4: WFOCLASSIFY
The WFOCLASSIFY module creates a separate k-means model for each training set of the walk forward analysis. It firstly exports all the data of a single train cycle to a CSV file. On the last bar of the train cycle, it then imports that data into R, creates the k-means model for that train cycle and saves it to disk. It then repeats this process for each train cycle.
...
#ifdef WFOCLASSIFY // save a cluster model for each training cycle
    LookBack = 0;
    int i;
    if(is(INITRUN)) {
        Rstart("Zorro_kmeans.r",2); // file loads the libraries required in the analysis - hangs if they are not already installed
        if(!RCheck()) return;
        printf("\ntestBars: %3.3f, trainBars: %3.3f\n", testBars, trainBars);
        for (i=1; i <= cycles; i++) {
            file_delete(strf("Data\\export_%d.csv", i));
        }
    }
        //SEND ALL DATA IN THE CYCLE TO R, CREATE KMEANS MODEL FOR EACH CYCLE AND SAVE TO FILE
            ASSETLOOP {
                vars Open = series(priceOpen());
                vars High = series(priceHigh());
                vars Low = series(priceLow());
                vars Close = series(priceClose());
                var HO = High[0] / Open[0];
                var LO = Low[0] / Open[0];
                var CO = Close[0] / Open[0];
    for (i=1; i<=cycles; i++) {
        if (Bar > (i-1)*testBars and Bar <= (i-1)*testBars + trainBars) {
                char line[100];
                sprintf(line,
                    "%1.5f, %1.5f, %1.5f\n",
                    HO,LO,CO);
                file_append(strf("Data\\export_%d.csv", i),line);
                printf("\ncycle: %d, trainBars: %3.3f\n", i, floor((i-1)*testBars + trainBars));
                if (Bar == floor((i-1)*testBars + trainBars)) {
                    Rx(strf("data <- read.csv('C:/PATH/Zorro/Data/export_%d.csv', header = FALSE)", i)); // mind the forward slashes and file path
                    Rx("class_factors <- data[, 1:3] ");
                    Rx("colnames(class_factors) <- c('HO', 'LO', 'CO')");
                    Rset("num_clusters", numClusters);
                    Rx("set.seed(123)"); // required in order to reproduce results
                    Rx("fit <- kmeans(class_factors, num_clusters)");
                   char model_name[40];
                    Rx(strf("save(fit, file = 'C:/PATH/Zorro/Data/kmeans_fit_%d.rda')", i)); // save model for later use - generic naming convention
                    }
                }
            }
        }
#endif
...
Module 5: WFOTRAIN
The WFOTRAIN module tests the performance of an n-day ahead strategy for each cluster in each direction separately for each training data set. It does this by opening a trade in each direction and holding that trade for n days. The profit or loss of the trade is assigned to the cluster type of the candle upon whose close the trade was opened. Results of each strategy are tallied and a performance metric for each strategy is saved to disk. The default performance metric that I have used is profit factor, but it is trivial to include whatever performance metric is relevant. The user needs to ensure that the data sent to the k-means module by the WFOTRAIN module is the same as the data that the model was built on. If the model was built on high, low, close to open price ratios, it obviously needs this same information to classify incoming candles. In this version, it is up to the user to ensure consistency between modules.
The WFOTRAIN module essentially runs an in sample test by assessing the performance of the clustering strategy on the data upon which the clustering model was built. In practical terms, it would be impossible to make the trades that WFOTRAIN makes since they require knowledge of the clusters formed by the algorithm. But from the point of view of the strategy, the clusters are not formed until some time in the future. By definition, this is impossible.
In the code below, note the use of the while(algo(loop(…))) call. This loop is a Zorro-specific function that enables trade statistics to be separated into different ‘algos’ and is extremely useful in applications such as this one. The user needs to manually ensure that there is an ‘algo’ call for both trade directions for every clusters. In this example, we will stick with six clusters, so we need a total of twelve algos to capture the performance of each in both directions.
...
#ifdef WFOTRAIN // test cluster performance on each training cycle
// TRADE LONG AND SHORT STRATEGIES FOR EACH CLUSTER AND SAVE THE RESULTS IN A FILE FOR LATER USE
    int cluster;
    static int loopCounter;
    if(is(INITRUN)) {
        file_delete("Data\\profitFactors.csv");
        loopCounter = 0;
        Rstart("Zorro_kmeans.r",2); // file loads the libraries required in the analysis - hangs if they are not already installed
        if(!RCheck()) return;
    }
    ASSETLOOP {
        vars Open = series(priceOpen());
        vars High = series(priceHigh());
        vars Low = series(priceLow());
        vars Close = series(priceClose());
                var HO = High[0] / Open[0];
        var LO = Low[0] / Open[0];
        var CO = Close[0] / Open[0];
        int i;
        for (i=1; i<=cycles; i++) {
            if (Bar > floor((i-1)*testBars) and Bar <= floor((i-1)*testBars + trainBars)) {
                if(!is(LOOKBACK)) {
                    Rx(strf("load(file = 'C:/PATH/Zorro/Data/kmeans_fit_%d.rda')", i));
                    Rset("HO", HO);
                    Rset("LO", LO);
                    Rset("CO", CO); // the R variable names need to match the factors in the saved k-means model
                    Rx("predict_data <- data.frame(HO, LO, CO)");
                    cluster = Ri("predict.kmeans(fit, data = predict_data)");
                    // trade logic
                    ExitTime = 2; // trade time of one day
                    TradesPerBar = numClusters*2;
                    while(algo(loop("cluster1_Long", "cluster1_short", "cluster2_Long", "cluster2_short", "cluster3_Long", "cluster3_short", "cluster4_Long", "cluster4_short",
                        "cluster5_Long", "cluster5_short", "cluster6_Long", "cluster6_short"))) { // add a long and short algo for each cluster
                        if (Algo == "cluster1_Long") {
                            if (cluster == 1) enterLong();
                        }
                        if (Algo == "cluster1_Short") {
                            if (cluster == 1) enterShort();
                        }
                        if (Algo == "cluster2_Long") {
                            if (cluster == 2) enterLong();
                        }
                        if (Algo == "cluster2_Short") {
                            if (cluster == 2) enterShort();
                        }
                        if (Algo == "cluster3_Long") {
                            if (cluster == 3) enterLong();
                        }
                        if (Algo == "cluster3_Short") {
                            if (cluster == 3) enterShort();
                        }
                        if (Algo == "cluster4_Long") {
                            if (cluster == 4) enterLong();
                        }
                        if (Algo == "cluster4_Short") {
                            if (cluster == 4) enterShort();
                        }
                        if (Algo == "cluster5_Long") {
                            if (cluster == 5) enterLong();
                        }
                        if (Algo == "cluster5_Short") {
                            if (cluster == 5) enterShort();
                        }
                        if (Algo == "cluster6_Long") {
                            if (cluster == 6) enterLong();
                        }
                        if (Algo == "cluster6_Short") {
                            if (cluster == 6) enterShort();
                        }
                        if (Bar == floor((i-1)*testBars + trainBars)) {
                            string currentAlgo = Algo;
                            var wins = 0;
                            var losses = 0;
                            for(all_trades) {
                                if (strstr(currentAlgo, TradeAlgo) and strstr(currentAsset, Asset) and TradeProfit > 0 and TradeBarOpen > floor((i-1)*testBars) and TradeBarOpen <= floor((i-1)*testBars + trainBars))
                                    wins += TradeProfit;
                                if (strstr(currentAlgo, TradeAlgo) and strstr(currentAsset, Asset)  and TradeProfit <= 0 and TradeBarOpen > floor((i-1)*testBars) and TradeBarOpen <= floor((i-1)*testBars + trainBars))
                                    losses += TradeProfit;
                            }
                            var profitFactor = 0;
                            if (losses != 0) profitFactor = abs(wins/losses);
                            else profitFactor = 1.0;
                            PF[loopCounter] = profitFactor;
                            char line[40];
//                          sprintf(line, "%s_%s_cycle_%d, %1.2f\n", Asset, Algo, i, profitFactor); output prfit factors with descriptions
                            sprintf(line, "%1.2f\n", profitFactor); //output profit factors only, no descriptions
                            file_append("Data\\profitFactors.csv", line);
                            loopCounter += 1;
                        }
                }
            }
        }
    }
}
printf("\nPF0: %1.3f\n", PF[0]);
printf("\nloopCounter: %d\n", loopCounter);
if (is(EXITRUN)) file_write("Data\\profitFactors.bin", PF, 10*cycles*numClusters*2*sizeof(var));
#endif
...
This script outputs a profit factor for each strategy that was tested for the training set of each walk forward cycle. The chart below shows the profit factor for each strategy and cycle.
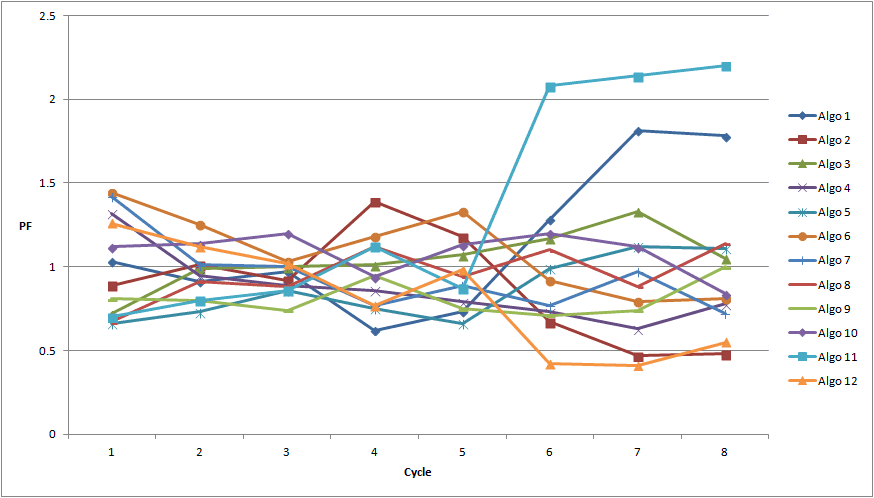
What’s interesting is that as we progress through the cycles, we see that certain strategies tend to have periods of profitability and periods of sustained loss. While some strategies perform better than others, no single strategy is consistently profitable. Do these periods of profitability persist for long enough to make a profit in the out of sample period? It is the objective of the next module to shed some light on that question.
Module 6: WFOTEST
WFOTEST runs a series of tests on the out of sample portion of each walk forward cycle. It tests out of sample those strategies whose in sample performance exceeds the user-defined threshold and skips over the others.
#ifdef WFOTEST // test out of sample performance in a rolling walk forward
    LookBack = cycles*numClusters*2*numAssets+2;
    int cluster;
    if(is(INITRUN)) {
        file_delete("Data\\profitFactorsTest.csv");
        static vars pfact;
        pfact=series(0, cycles*numClusters*2*numAssets+1);
        file_read("Data\\profitFactors.bin", pfact, 10*cycles*numClusters*2*sizeof(var)); //cycles*numClusters*2*sizeof(var));
        int r;
        for (r=0; r<cycles*numClusters*2*numAssets; r++) {
            PF[r] = pfact[r];
        }
        loopCounterTest = 0;
        Rstart("Zorro_kmeans.r",2); // file loads the libraries required in the analysis - hangs if they are not already installed
        if(!RCheck()) return;
        }
    ASSETLOOP {
        vars Open = series(priceOpen());
        vars High = series(priceHigh());
        vars Low = series(priceLow());
        vars Close = series(priceClose());
                var HO = High[0] / Open[0];
        var LO = Low[0] / Open[0];
        var CO = Close[0] / Open[0];
        if(!is(LOOKBACK)) {
            int i;
            for (i = 1; i <= cycles; i++) {
            if (Bar > floor((i-1)*testBars + trainBars) and Bar <= i*testBars + trainBars) { //bar number is within cycle i's out of sample period
                Rx(strf("load(file = 'C:PATH/Zorro/Data/kmeans_fit_%d.rda')", i));
                Rset("HO", HO);
                Rset("LO", LO);
                Rset("CO", CO); // the R variable names need to match the factors in the saved k-means model
                Rx("predict_data <- data.frame(HO, LO, CO)");
                cluster = Ri("predict.kmeans(fit, data = predict_data)");
            // trade logic
                ExitTime = 2; // trade time of one day
                TradesPerBar = 2*numClusters;
                while(algo(loop("cluster1_Long", "cluster1_short", "cluster2_Long", "cluster2_short", "cluster3_Long", "cluster3_short", "cluster4_Long", "cluster4_short", "cluster5_Long", "cluster5_short", "cluster6_Long", "cluster6_short"))) { //// add a long and short algo for each cluster,
                    if (Algo == "cluster1_Long" and PF[(i-1)*2*numClusters + 0] > threshold) {
                        if (cluster == 1) enterLong();
                        }
                    if (Algo == "cluster1_Short" and PF[(i-1)*2*numClusters + 1] >threshold) {
                        if (cluster == 1) enterShort();
                    }
                    if (Algo == "cluster2_Long" and PF[(i-1)*2*numClusters + 2] > threshold) {
                        if (cluster == 2) enterLong();
                    }
                    if (Algo == "cluster2_Short" and PF[(i-1)*2*numClusters + 3] > threshold) {
                        if (cluster == 2) enterShort();
                    }
                    if (Algo == "cluster3_Long" and PF[(i-1)*2*numClusters + 4] > threshold) {
                        if (cluster == 3) enterLong();
                    }
                    if (Algo == "cluster3_Short" and PF[(i-1)*2*numClusters + 5] > threshold) {
                        if (cluster == 3) enterShort();
                    }
                    if (Algo == "cluster4_Long" and PF[(i-1)*2*numClusters + 6] > threshold) {
                        if (cluster == 4) enterLong();
                    }
                    if (Algo == "cluster4_Short" and PF[(i-1)*2*numClusters + 7] > threshold) {
                        if (cluster == 4) enterShort();
                    }
                    if (Algo == "cluster5_Long" and PF[(i-1)*2*numClusters + 8] > threshold) {
                        if (cluster == 5) enterLong();
                    }
                    if (Algo == "cluster5_Short" and PF[(i-1)*2*numClusters + 9] > threshold) {
                        if (cluster == 5) enterShort();
                    }
                    if (Algo == "cluster6_Long" and PF[(i-1)*2*numClusters + 10] > threshold) {
                        if (cluster == 6) enterLong();
                    }
                    if (Algo == "cluster6_Short" and PF[(i-1)*2*numClusters + 11] > threshold) {
                        if (cluster == 6) enterShort();
                    }
                    if (Bar == floor(i*testBars + trainBars) or is(EXITRUN)) {
                        string currentAlgo = Algo;
                        var wins = 0;
                        var losses = 0;
                        for(all_trades) {
                            if (strstr(currentAlgo, TradeAlgo) and TradeProfit > 0 and TradeBarOpen > floor((i-1)*testBars + trainBars) and TradeBarOpen <= floor(i*testBars + trainBars))
                                wins += TradeProfit;
                            if (strstr(currentAlgo, TradeAlgo) and TradeProfit <= 0 and TradeBarOpen > floor((i-1)*testBars + trainBars) and TradeBarOpen <= floor(i*testBars + trainBars))
                                losses += TradeProfit;
                            }
                        var profitFactorTest = 0;
                        if (losses != 0) profitFactorTest = abs(wins/losses);
                            char line[40];
                            sprintf(line, "%s, %s, %d, %1.2f\n", Asset, Algo, i, profitFactorTest);
                            file_append("Data\\profitFactorsTest.csv",line);
                        }
                    }
                }
            }
        }
    }
#endif
...
And a summary of the results:
Annual return       -7%
Profit factor       0.93 (PRR 0.84)
Sharpe ratio        -0.27
Kelly criterion     -0.99
R2 coefficient      0.334
Ulcer index         100.0%
Prediction error    64%
Portfolio analysis  OptF  ProF  Win/Loss  Wgt%
cluster1_Long avg   .008  1.17   63/37   -28.0
cluster1_short avg  .000  0.24    4/8     16.6
cluster2_Long avg   .000  0.80   48/57    29.0
cluster2_short avg  .000  ----    0/0     -0.0
cluster3_Long avg   .000  0.87   26/23    10.6
cluster3_short avg  .000  0.84   50/57    37.7
cluster4_Long avg   .073  4.35    3/1    -20.3
cluster4_short avg  .003  1.05   58/61    -9.1
cluster5_Long avg   .000  ----    0/0     -0.0
cluster5_short avg  .000  0.90   79/85    33.8
cluster6_Long avg   .036  2.16    9/4    -23.4
cluster6_short avg  .000  0.78   34/46    53.0
A number of strategies resulted in a low number of trades in the walk forward test. We can’t draw any conclusions about these, and it may be useful to reduce the number of clusters or provide more data for the out of sample portion. Of course, there are the usual trade-offs around this and it would be up to the individual developer to make an appropriate decision given their circumstances. The results aren’t cause for great excitement, and overall money was lost by trading the strategies that made money during their in-sample period. However, as I mentioned at the start of the article, this is not so much about the results as it is about describing the use of the framework.
Adding data: two-candle patterns and multiple markets
Next I’ll investigate two-candle patterns across multiple markets. One way to capture a two-candle pattern would be to describe the relationship between the open, high and low to the close of each candle (as I did for the single candle example) and to describe the relationship between the mean price of the two candles. Another way would be to include single candle relationships and the relationship between the first candle’s open, high and low with the close of the second candle. There are of course others, and creativity is encouraged. I’ll use the former in this example.
Including the additional data is simply a matter of adding some lines of code to calculate the relevant data and send them to R in the WFOCLASSIFY, WFOTEST and WFOTRAIN modules:
...
vars Open = series(priceOpen());
vars High = series(priceHigh());
vars Low = series(priceLow());
vars Close = series(priceClose());
vars Mean = series(price());
var HO = High[0] / Open[0];
var LO = Low[0] / Open[0];
var CO = Close[0] / Open[0];
var HO1 = High[1] / Open[1];
var LO1 = Low[1] / Close[1];
var CO1 = Close[1] / Open[1];
var Mratio = Mean[1]/Mean[0];
...
char line[100];
sprintf(line,
   %1.5f, %1.5f, %1.5f, %1.5f, %1.5f, %1.5f, %1.5f\n",
   HO,LO,CO, HO1, CO1, LO1, Mratio);
file_append(strf("Data\\export_%d.csv", i),line);
if (Bar == floor((i-1)*testBars + trainBars)) {
    Rx(strf("data <- read.csv('C:PATH/Zorro/Data/export_%d.csv', header = FALSE)", i)); // mind the forward slashes and file path
    Rx("class_factors <- data[, 1:7] ");
    Rx("colnames(class_factors) <- c('HO', 'LO', 'CO', 'HO1', 'LO1', 'CO1', 'Mratio')");
    Rset("num_clusters", numClusters);
    Rx("set.seed(123)"); // required in order to reproduce results
    Rx("fit <- kmeans(class_factors, num_clusters)");
...
And adding additional assets is simply a matter of updating the while(asset(loop(…))) call and the user-supplied variables as follows:
#define ASSETLOOP while(asset(loop("EUR/JPY", "GBP/JPY", "USD/JPY"))) //))) // asset loop for wfo test
int numAssets = 4; // user input required to match number of assets in asset loop
int cycles = 4; //number of test/train cycles
var testProp = 0.5; //proportion of data per cycle to be assigned to test set
int numClusters = 6; //set number of clusters to group candles into
static var PF[192]; // set array to dims [cycles * clusters * Assets * 2]
And here are the results of the walk forward test:
Annual return       -15%
Profit factor       0.91 (PRR 0.86)
Sharpe ratio        -0.53
Kelly criterion     -1.89
R2 coefficient      0.571
Ulcer index         100.0%
Prediction error    49%
Portfolio analysis  OptF  ProF  Win/Loss  Wgt%
EUR/JPY avg         .002  0.93  371/425   24.7
GBP/JPY avg         .007  0.89  376/410   54.7
USD/JPY avg         .007  0.92  436/441   20.6
cluster1_Long avg   .000  0.77  200/234   37.1
cluster1_short avg  .000  0.97  413/435   12.6
cluster2_Long avg   .000  ----    0/0     -0.0
cluster2_short avg  .001  0.86  234/263   31.6
cluster3_Long avg   .011  1.06  172/179   -7.7
cluster3_short avg  .000  0.37    9/11    17.0
cluster4_Long avg   .000  ----    0/0     -0.0
cluster4_short avg  .000  ----    0/0     -0.0
cluster5_Long avg   .000  0.43   12/21    15.7
cluster5_short avg  .025  1.09   11/8     -1.1
cluster6_Long avg   .037  2.10   69/35   -37.4
cluster6_short avg  .000  0.65   63/90    32.3
And the sad-looking equity curve (the equity curve shown is for the portfolio of instruments traded; the price curve of one of the assets is superimposed):
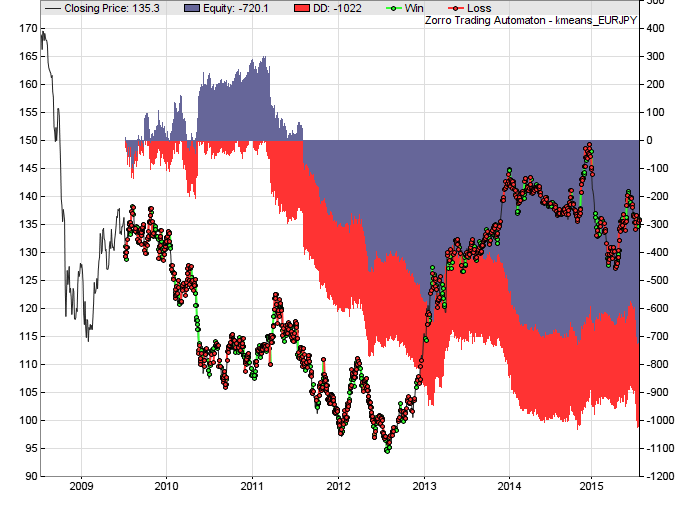
Again, there was at least one good performer during the out of sample testing periods, although of course there would have been no way to have known a priori to include it and exclude the others that performed well in sample. Clearly, for this approach to be viable, another method of strategy filtering is required.
Summary
I’ve presented a framework for investigating k-means clustering based trading strategies with the intention of facilitating efficient and robust research and development. Some notable findings and key points:
- This framework facilitates the exploration of ideas for k-means. Ideas for immediate investigation include intra-day time frames, other markets and asset classes and other data including two and three candle patterns, trend information and volatility information.
- The main benefits of using the framework are that the user can quickly and easily change parameters such as the number of clusters, the number of cycles and the test/train data split, the bar period and the assets used in the analysis.
- With slightly more effort, it is possible to investigate different data for input to the k-means algorithm.
- A walk forward test is not a panacea for eliminating bias. It is easy to abuse: by comparing the results of more than one walk forward test and selecting the better performer, selection bias has been introduced.
- Single candlestick patterns, at least as defined by the k-means clustering algorithm for the EUR/JPY exchange rate, appeared to go through periods of varying predictive utility.
- Two-candle patterns, at least as defined in this example, did not hold up particularly well to rolling out of sample testing.
I’m not convinced that k-means clustering will lead to a profitable trading strategy. However, I will proceed to undertake a more detailed, systematic investigation now that I have a tool to do so efficiently. If any reader is interested in sharing the research load, I’d love to hear from you.
Some notes for users of the walk forward framework
Following is a summary of the pitfalls to be aware of when using this script:
- If you change the number of clusters, you also need to change the trade logic , that is, add or take away entry conditions for the clusters under investigation.
- Make sure the file path is set up correctly wherever it is required throughout the script. R uses froward slashes!
- Add other data to the k-means algorithm by adding the additional lines of code in the Zorro script and then export to R.
- The WFOSETUP module must be included when running the other three WFO modules.
- Data used in the k-means algorithm must be consistent between modules for the analysis to make sense.
- Make sure the user-supplied parameters are correct. Incorrect parameters will cause the script to either crash or return absurd results.
- It may be possible to replace the WFOTEST and WFOTRAIN modules with Zorro’s built-in walk-forward implementation. Replace the #ifdefs for each routine with if(is(TEST)) and if(is(TRAIN)) respectively, and re-work the user supplied parameters to be in line with Zorro’s WFO setup if this is preferred.
The full code for the framework is included below:
///////////// ============= Framework for rapid, robust prototyping of strategies based on k-means clustering algorithm ====================/////
///////////////////////////////////////////////////////////////////////////////////////////////////////////////////////////////////////////////
// Options: //
// (A) SINGLE MODELS //
// 1. DATAEXPORT: Export specified data set to R and create k-means clustering algorithm on the entire data set //
// 2. RUNSINGLE: Test a single instance of the model built in (1). Useful for quickly checking model validity, but not a robust development method //
// (B) ROLLING WALK FORWARD FRAMEWORK //
// 3. WFOCLASSIFY: Construct a series of k-means models over a moving window, optionally using multiple assets //
// 4. WFOTRAIN: Test the n-day ahead performance of each cluster in long and short directions over the period from which the model was built //
// 5. WFOTEST: Test (4) in a rolling, out of sample, walk forward test //
// //
// Instructions:
// For single models, run DATAEXPORT followed by RUNSINGLE
//
// For rolling walk forward, uncomment WFOSETUP
// The other models need to be run in the order written.
// First run WFOCLASSIFY to build a k-menas model for each windo.
// Then run WFOTRAIN to assess performance over period for which each of clusteriing models were built
// Finally run WFOTEST to assess performance in the subsequent out of sample period for each window
//
// User controlled variables below
// To change the data upon which the k-means models are built, the script will need to be altered. Ensure changes are consistent between
// classification, test and train routines otherwise R will return an error.
//
///////////////////////////////////////////////////////////////////////////////////////////////////////////////////////////////////////////////
//////////// (A) SINGLE MODELS - UNCOMMENT DESIRED FUNCTION
//#define DATAEXPORT // exports data to R and builds single classification model
//#define RUNSINGLE // runs a single cluster strategy test based on defined trading parameters and k-menas model built by DATAEXPORT
//////////// (B) ROLLING WALK FORWARD FRAMEWORK - UNCOMMENT DESIRED FUNCTIONS
#define WFOSETUP // WFO paramters - this must be defined for all WFO routines defined below (ie leave uncommented)
//#define WFOCLASSIFY // builds a series of models for use in WFO test. requires....
//#define WFOTRAIN // runs a series of cluster strategies on in-sample data and saves results to file. requires...
#define WFOTEST // runs a walk forward out of sample test using models selected by wfoTrain routine. requies ....
//////////// USER-CONTROLLED VARIABLES
// variables and user inputs required to be consistent across training and test runs: therefore set here rather than duplicating across test and train routines
// note some trade paramters have to be set up after the asset loop call. eg ExitTime. If changing these, ensure the changes are consistent
#define ASSETLOOP while(asset(loop("EUR/JPY"))) //, "AUD/JPY", "GBP/JPY", "USD/JPY"))) // asset loop for wfo test
#include <r.h>
int numAssets = 1; // user input required to match number of assets in asset loop
int cycles = 5; //number of test/train cycles
var testProp = 0.5; //proportion of data per cycle to be assigned to test set
int numClusters = 6; //set number of clusters to group candles into
static var PF[60]; // set array to dims [cycles * clusters * Assets * 2]
var threshold = 1.1; // profit factor threshold in training set to trade in out of sample test
bool RCheck()
{
if(!Rrun()) {
quit("R session aborted!!");
return false;
}
return true;
}
function run() {
BarPeriod = 1440;
PlotWidth = 600;
#ifdef DATAEXPORT // export historical data and build clustering model
LookBack = 0;
StartDate = 2008;
EndDate = 2014;
vars Open = series(priceOpen());
vars High = series(priceHigh());
vars Low = series(priceLow());
vars Close = series(priceClose());
var HO = High[0] / Open[0];
var LO = Low[0] / Open[0];
var CO = Close[0] / Open[0];
char line[100];
sprintf(line,
"%1.5f, %1.5f, %1.5f\n",
HO,LO,CO);
if(is(INITRUN))
file_delete("Data\\export.csv");
else
file_append("Data\\export.csv",line);
if (is(EXITRUN)) {
Rstart("Zorro_kmeans.r",2);
if(!RCheck()) return;
Rx("data <- read.csv('C:/PATH/Zorro/Data/export.csv', header = FALSE)"); // mind the forward slashes and file path
Rx("class_factors <- data[, 1:3] ");
Rx("colnames(class_factors) <- c('HO', 'LO', 'CO')");
Rset("num_clusters", numClusters);
Rx("set.seed(123)"); // required in order to reproduce results
Rx("fit <- kmeans(class_factors, num_clusters)");
Rx("save(fit, file = 'C:/PATH/Zorro/Data/kmeans_fit.rda')"); // save model for later use - generic naming convention
}
#endif
#ifdef RUNSINGLE // run a single test using trade logic defined below
LookBack = 1;
StartDate = 2010;
EndDate = 2015;
int cluster;
if(is(INITRUN)) {
Rstart("Zorro_kmeans.r",2); // file loads the libraries required in the analysis - hangs if they are not already installed
Rx("load(file = 'C:/PATH/Zorro/Data/kmeans_fit.rda')");
if(!RCheck()) return;
}
vars Open = series(priceOpen());
vars High = series(priceHigh());
vars Low = series(priceLow());
vars Close = series(priceClose());
// reversed series to pass to R
vars HO = rev(series(High[0] / Open[0]));
vars LO = rev(series(Low[0] / Open[0]));
vars CO = rev(series(Close[0] / Open[0]));
if(!is(LOOKBACK)) {
Rset("HO", HO, 1);
Rset("LO", LO, 1);
Rset("CO", CO, 1); // the R variable names need to match the factors in the saved k-means model
Rx("predict_data <- data.frame(HO, LO, CO)");
cluster = Ri("predict.kmeans(fit, data = predict_data)");
// trade logic
ExitTime = 2; // trade time of one day
if (cluster == 3) {
enterShort();
}
else if (cluster == 6) {
enterLong();
}
}
#endif
#ifdef WFOSETUP // set up WFO parameters
StartDate = 2008;
EndDate = 2015;
var split = testProp/(1-testProp);
var testBars = NumBars/(cycles + split);
var trainBars = split*testBars;
// printf("\ntestBars: %3.3f, trainBars: %3.3f\n", testBars, trainBars);
#endif
#ifdef WFOCLASSIFY // save a cluster model for each training cycle
LookBack = 0;
int i;
if(is(INITRUN)) {
Rstart("Zorro_kmeans.r",2); // file loads the libraries required in the analysis - hangs if they are not already installed
if(!RCheck()) return;
printf("\ntestBars: %3.3f, trainBars: %3.3f\n", testBars, trainBars);
for (i=1; i <= cycles; i++) {
file_delete(strf("Data\\export_%d.csv", i));
}
}
//SEND ALL DATA IN THE CYCLE TO R, CREATE KMEANS MODEL FOR EACH CYCLE AND SAVE TO FILE
ASSETLOOP {
vars Open = series(priceOpen());
vars High = series(priceHigh());
vars Low = series(priceLow());
vars Close = series(priceClose());
var HO = High[0] / Open[0];
var LO = Low[0] / Open[0];
var CO = Close[0] / Open[0];
for (i=1; i<=cycles; i++) {
if (Bar > (i-1)*testBars and Bar <= (i-1)*testBars + trainBars) {
char line[100];
sprintf(line,
"%1.5f, %1.5f, %1.5f\n",
HO,LO,CO);
file_append(strf("Data\\export_%d.csv", i),line);
printf("\ncycle: %d, trainBars: %3.3f\n", i, floor((i-1)*testBars + trainBars));
if (Bar == floor((i-1)*testBars + trainBars)) {
Rx(strf("data <- read.csv('C:/PATH/Zorro/Data/export_%d.csv', header = FALSE)", i)); // mind the forward slashes and file path
Rx("class_factors <- data[, 1:3] ");
Rx("colnames(class_factors) <- c('HO', 'LO', 'CO')");
Rset("num_clusters", numClusters);
Rx("set.seed(123)"); // required in order to reproduce results
Rx("fit <- kmeans(class_factors, num_clusters)");
char model_name[40];
Rx(strf("save(fit, file = 'C:/PATH/Zorro/Data/kmeans_fit_%d.rda')", i)); // save model for later use - generic naming convention
}
}
}
}
#endif
#ifdef WFOTRAIN // test cluster performance on each training cycle
// TRADE LONG AND SHORT STRATEGIES FOR EACH CLUSTER AND SAVE THE RESULTS IN A FILE FOR LATER USE
int cluster;
static int loopCounter;
if(is(INITRUN)) {
file_delete("Data\\profitFactors.csv");
loopCounter = 0;
Rstart("Zorro_kmeans.r",2); // file loads the libraries required in the analysis - hangs if they are not already installed
if(!RCheck()) return;
}
ASSETLOOP {
// LOOP THROUGH VARIOUS ASSETS TO TEST IF THE PATTERNS PERSIST ACROSS MARKETS
vars Open = series(priceOpen());
vars High = series(priceHigh());
vars Low = series(priceLow());
vars Close = series(priceClose());
var HO = High[0] / Open[0];
var LO = Low[0] / Open[0];
var CO = Close[0] / Open[0];
int i;
for (i=1; i<=cycles; i++) {
if (Bar > floor((i-1)*testBars) and Bar <= floor((i-1)*testBars + trainBars)) {
if(!is(LOOKBACK)) {
Rx(strf("load(file = 'C:/PATH/Zorro/Data/kmeans_fit_%d.rda')", i));
Rset("HO", HO);
Rset("LO", LO);
Rset("CO", CO); // the R variable names need to match the factors in the saved k-means model
Rx("predict_data <- data.frame(HO, LO, CO)");
cluster = Ri("predict.kmeans(fit, data = predict_data)");
// trade logic
ExitTime = 2; // trade time of one day
TradesPerBar = numClusters*2;
while(algo(loop("cluster1_Long", "cluster1_short", "cluster2_Long", "cluster2_short", "cluster3_Long", "cluster3_short", "cluster4_Long", "cluster4_short", "cluster5_Long", "cluster5_short", "cluster6_Long", "cluster6_short"))) { // // add a long and short algo for each cluster
if (Algo == "cluster1_Long") {
if (cluster == 1) enterLong();
}
if (Algo == "cluster1_Short") {
if (cluster == 1) enterShort();
}
if (Algo == "cluster2_Long") {
if (cluster == 2) enterLong();
}
if (Algo == "cluster2_Short") {
if (cluster == 2) enterShort();
}
if (Algo == "cluster3_Long") {
if (cluster == 3) enterLong();
}
if (Algo == "cluster3_Short") {
if (cluster == 3) enterShort();
}
if (Algo == "cluster4_Long") {
if (cluster == 4) enterLong();
}
if (Algo == "cluster4_Short") {
if (cluster == 4) enterShort();
}
if (Algo == "cluster5_Long") {
if (cluster == 5) enterLong();
}
if (Algo == "cluster5_Short") {
if (cluster == 5) enterShort();
}
if (Algo == "cluster6_Long") {
if (cluster == 6) enterLong();
}
if (Algo == "cluster6_Short") {
if (cluster == 6) enterShort();
}
if (Bar == floor((i-1)*testBars + trainBars)) {
string currentAlgo = Algo;
string currentAsset = Asset;
var wins = 0;
var losses = 0;
for(all_trades) {
if (strstr(currentAlgo, TradeAlgo) and strstr(currentAsset, Asset) and TradeProfit > 0 and TradeBarOpen > floor((i-1)*testBars) and TradeBarOpen <= floor((i-1)*testBars + trainBars))
wins += TradeProfit;
if (strstr(currentAlgo, TradeAlgo) and strstr(currentAsset, Asset) and TradeProfit <= 0 and TradeBarOpen > floor((i-1)*testBars) and TradeBarOpen <= floor((i-1)*testBars + trainBars))
losses += TradeProfit;
}
var profitFactor = 0;
if (losses != 0) profitFactor = abs(wins/losses);
else profitFactor = 1.0;
PF[loopCounter] = profitFactor;
char line[40];
// sprintf(line, "%s_%s_cycle_%d, %1.2f\n", Asset, Algo, i, profitFactor); output prfit factors with descriptions
sprintf(line, "%1.2f\n", profitFactor); //output profit factors only, no descriptions
file_append("Data\\profitFactors.csv", line);
loopCounter += 1;
}
}
}
}
}
}
if (is(EXITRUN)) file_write("Data\\profitFactors.bin", PF, 10*cycles*numClusters*2*sizeof(var));
#endif
#ifdef WFOTEST // test out of sample performance in a rolling walk forward
LookBack = cycles*numClusters*2*numAssets+2;
int cluster;
if(is(INITRUN)) {
file_delete("Data\\profitFactorsTest.csv");
static vars pfact;
pfact=series(0, cycles*numClusters*2*numAssets+1);
file_read("Data\\profitFactors.bin", pfact, 10*cycles*numClusters*2*sizeof(var)); //cycles*numClusters*2*sizeof(var));
int r;
for (r=0; r<cycles*numClusters*2*numAssets; r++) {
PF[r] = pfact[r];
}
Rstart("Zorro_kmeans.r",2); // file loads the libraries required in the analysis - hangs if they are not already installed
if(!RCheck()) return;
}
ASSETLOOP {
vars Open = series(priceOpen());
vars High = series(priceHigh());
vars Low = series(priceLow());
vars Close = series(priceClose());
var HO = High[0] / Open[0];
var LO = Low[0] / Open[0];
var CO = Close[0] / Open[0];
if(!is(LOOKBACK)) {
int i;
for (i = 1; i <= cycles; i++) {
if (Bar > floor((i-1)*testBars + trainBars) and Bar <= i*testBars + trainBars) { //bar number is within cycle i's out of sample period
Rx(strf("load(file = 'C:/PATH/Zorro/Data/kmeans_fit_%d.rda')", i));
Rset("HO", HO);
Rset("LO", LO);
Rset("CO", CO); // the R variable names need to match the factors in the saved k-means model
Rx("predict_data <- data.frame(HO, LO, CO)");
cluster = Ri("predict.kmeans(fit, data = predict_data)");
// trade logic
ExitTime = 2; // trade time of one day
TradesPerBar = 20;
while(algo(loop("cluster1_Long", "cluster1_short", "cluster2_Long", "cluster2_short", "cluster3_Long", "cluster3_short", "cluster4_Long", "cluster4_short", "cluster5_Long", "cluster5_short", "cluster6_Long", "cluster6_short"))) { //// add a long and short algo for each cluster,
if (Algo == "cluster1_Long" and PF[(i-1)*2*numClusters + 0] > threshold) {
if (cluster == 1) enterLong();
}
if (Algo == "cluster1_Short" and PF[(i-1)*2*numClusters + 1] >threshold) {
if (cluster == 1) enterShort();
}
if (Algo == "cluster2_Long" and PF[(i-1)*2*numClusters + 2] > threshold) {
if (cluster == 2) enterLong();
}
if (Algo == "cluster2_Short" and PF[(i-1)*2*numClusters + 3] > threshold) {
if (cluster == 2) enterShort();
}
if (Algo == "cluster3_Long" and PF[(i-1)*2*numClusters + 4] > threshold) {
if (cluster == 3) enterLong();
}
if (Algo == "cluster3_Short" and PF[(i-1)*2*numClusters + 5] > threshold) {
if (cluster == 3) enterShort();
}
if (Algo == "cluster4_Long" and PF[(i-1)*2*numClusters + 6] > threshold) {
if (cluster == 4) enterLong();
}
if (Algo == "cluster4_Short" and PF[(i-1)*2*numClusters + 7] > threshold) {
if (cluster == 4) enterShort();
}
if (Algo == "cluster5_Long" and PF[(i-1)*2*numClusters + 8] > threshold) {
if (cluster == 5) enterLong();
}
if (Algo == "cluster5_Short" and PF[(i-1)*2*numClusters + 9] > threshold) {
if (cluster == 5) enterShort();
}
if (Algo == "cluster6_Long" and PF[(i-1)*2*numClusters + 10] > threshold) {
if (cluster == 6) enterLong();
}
if (Algo == "cluster6_Short" and PF[(i-1)*2*numClusters + 11] > threshold) {
if (cluster == 6) enterShort();
}
if (Bar == floor(i*testBars + trainBars) or is(EXITRUN)) {
string currentAlgo = Algo;
string currentAsset = Asset;
var wins = 0;
var losses = 0;
for(all_trades) {
if (strstr(currentAlgo, TradeAlgo) and strstr(currentAsset, Asset) and TradeProfit > 0 and TradeBarOpen > floor((i-1)*testBars + trainBars) and TradeBarOpen <= floor(i*testBars + trainBars))
wins += TradeProfit;
if (strstr(currentAlgo, TradeAlgo) and strstr(CurrentAsset, Asset) and TradeProfit <= 0 and TradeBarOpen > floor((i-1)*testBars + trainBars) and TradeBarOpen <= floor(i*testBars + trainBars))
losses += TradeProfit;
}
var profitFactorTest = 0;
if (losses != 0) profitFactorTest = abs(wins/losses);
char line[40];
sprintf(line, "%s, %s, %d, %1.2f\n", Asset, Algo, i, profitFactorTest);
file_append("Data\\profitFactorsTest.csv",line);
}
}
}
}
}
}
#endif
} 
Hi Kris,
I played around with your K-means framework, different assets, WFO cycles, clusters sizes, etc. Works perfect, although the results were nothing to write home about. But as you already mentioned that wasn’t the goal of this framework.
Your idea to persist model, profits, etc per WFO cycle and phase is perfect. It makes it possible to use this framework in a more general way: R-Analysis > train > test per WFO cycle. The WFO step structure is already in place you only have to tweak a “little” to persist your own R-analysis and pass-on your own data between R and Zorro per phase and add your own trade logic in train/test. In my case as a pair trader and relying heavily on mean reversion I’m planning to alter the framework so I can do some co-integration/TLS analysis per WFO cycle and add some basic mean reversion trade logic.
Hi Kris,
I played around with this K-means framework. I tried different train-test period ratio’s, different assets, clusters sizes, cycles. All worked perfectly well. I didn’t manage to produce any spectacular results, but that is as you mentioned beside the point of this article.
A good framework should give a developer a head start in the programming of new idea’s and I think this framework is just doing that. In my opinion this piece of software is a perfect example how to support Walkforward in combination with R-analysis in every WFO cycle.The WFO structure including the persistence approach between phases and cylces form the heart of this framework. I think it is possible for an intermediate programmer to tailor this k-means framework so it can also be used for other R-analysis than Kmeans clustering. In my case – as a pair trader – I would like to do some TLS or co-integration analysis per WFO cycle but I can image a lot of other scenarios where some special R analysis is needed per WFO cylce.
Hello Reinier, thanks for that awesome feedback! This framework is something that I put together quite a while back and have been wanting to revisit ever since. I’m really glad that someone is using it! I also love your idea of using as the basis for a pairs trading framework.