Candlestick patterns were used to trade the rice market in Japan back in the 1800’s. Steve Nison popularised the idea in the western world and claims that the technique, which is based on the premise that the appearance of certain patterns portend the future direction of the market, is applicable to modern financial markets. Today, he has a fancy website where he sells trading courses. Strange that he doesn’t keep this hugely profitable system to himself and make tons of money.
Since you’re reading a blog about quantitative trading, its unlikely that I need to convince you that patterns like “two crows” and “dark cloud cover” are not statistically significant predictors of the future (but I’d be happy to do a post about this if there is any interest – let me know in the comments). If only profitable trading were that easy!
So if these well-known patterns don’t have predictive power, are there any patterns that do? And if so, how could they be discovered? Unsupervised machine learning techniques offer one such potential solution. An unsupervised learner is simply one that makes no attempt to relate the data it learns about to some target or prediction; rather it focuses on describing and summarizing the data in new and (hopefully) interesting ways. Contrast this with a supervised learner, which aims to find relationships amongst the data that allow prediction of some target variable. Linear regression is a supervised learner.
I am going to attempt an exploration of price data using k-means clustering, which is an unsupervised learning algorithm capable of finding natural groupings (clusters) within a data set. Since k-means does this without any prior notion of what the clusters should look like, it can be very useful when knowledge discovery, as opposed to prediction is desired.
k-means attempts to group observations into clusters that are similar to each other, but different from the members of other clusters. The algorithm measures similarity by converting predictor values to co-ordinates in a z-dimensional space (where z is equal to the number of predictors in the data set) and minimizing the distance between observations within each cluster and maximizing the distances between observations in different clusters. Euclidian distance is normally used, but other measures of distance find certain fields of application.
The algorithm incorporates an element of randomness. It starts with an initial guess of cluster assignments and then iteratively modifies the assignments and assesses improvements in homogeneity before finally settling on a locally optimum solution. This means that slightly different results may be obtained depending on the initial guess of cluster assignments. Excessive changes and instability resulting from minor changes to the initial conditions may indicate that the data does not naturally cluster, or that the value of k should be modified.
The algorithm is flexible, efficient and simple. The drawback is that clusters formed using k-means can be without intrinsic meaning. For example, the algorithm can help one decide which group a particular observation belongs to, but it is up to the practitioner to find a way to action this intelligence.
Analysis
That background aside, lets dive into some analysis. For this particular investigation, my tool of choice is R. I’m going to use the kmeans algorithm from the cluster package. I’ll use the quantmod and fpc packages to handle time series data and to assist with plotting.
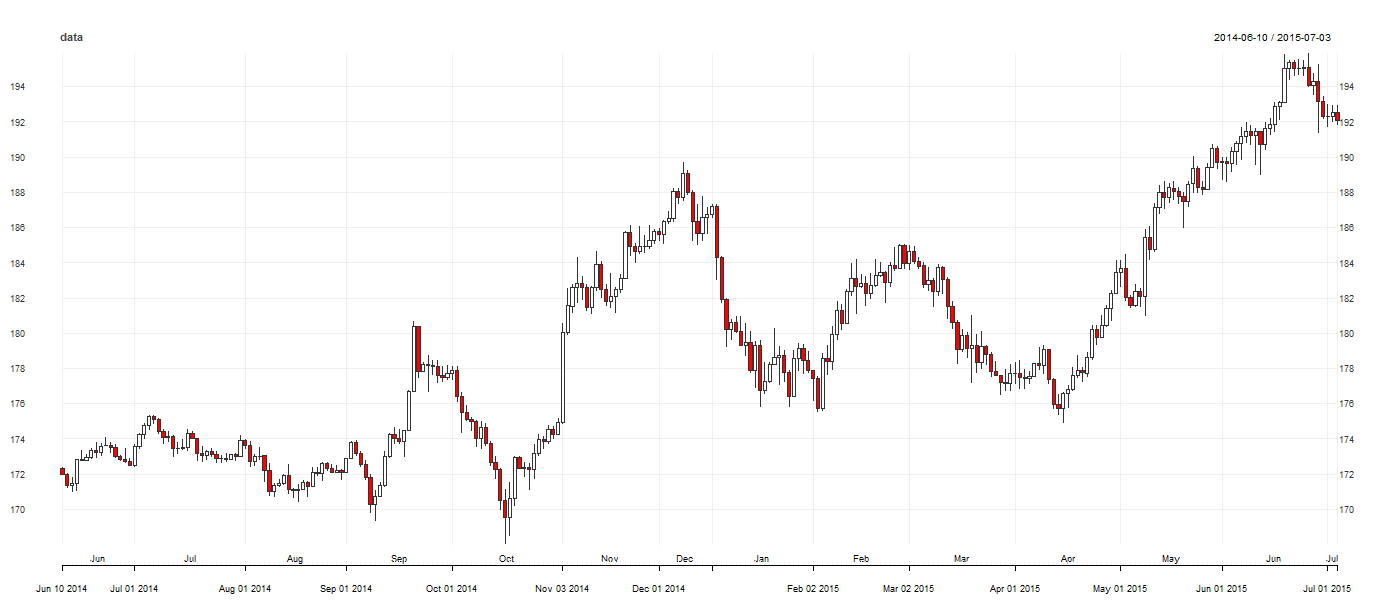
The first part of the analysis is to prepare the data, bring it into the R environment and perform some exploratory analysis. I’ll use daily high, low and close prices for GBP/JPY. Since forex is a 24 hour market, I’ll arbitrarily set the close time to 5:00 pm EST. I’ll plot the closing prices between July 2014 and July 2015 as candlesticks using the quantmod package. The following code reads in the price history data from a CSV file I created and plots the candles:
library(fpc)
library(cluster)
library(quantmod)
data <- read.csv("GBP_JPY.csv", stringsAsFactors = F)
colnames(data) <- c("Date", "GBP_JPY.Open", "GBP_JPY.High", "GBP_JPY.Low", "GBP_JPY.Close") # quantmod requires these names
data$Date <- as.POSIXct(data$Date, format = "%d/%m/%Y")
data <- as.xts(data[, -1], order.by = data[, 1])
data <- data[1684:nrow(data)-15, 1:4]
chart_Series(data)

Next, consider the information contained within candlesticks that could be interesting to explore. The distance between the high, low and close to the open springs immediately to mind. There’s also the upper and lower “wicks” (distance from the low to the open and from the high to the close for an up candle), the “body” (the distance between the high and low) and the range (the distance between the high and the low). Since these data can all be expressed in terms of the distance between the high, low, close and the open, I don’t think they will add additional predictive information to the model and will only add to processing time (I haven’t verified this, but it may be worth checking). There are also the relationships amongst the previous and current candle’s high, low, open and close. For stocks, volume may add another dimension, but this is less applicable to forex. It would also be interesting to add other data, such as a trend indicator or a time-based indicactor (for intra-day candlesticks). Be careful if analysing data from three or more candles: do you want the algorithm to relate the data contained within the third candle to the data contained in the first candle as well as the second? Or do you only want to consider adjacent candles? Zorro’s pattern analyser provides a simple implementation to easily manage this issue, but isn’t quite as flexible and “unspervised” as this implementation in R.
For now, I’ll just look at the relationships between the high, low and close and the open. Normalizing the data may improve the performance of the algorithm, but I’ll leave that out for now. The following code creates the data that will be fed to the k-means algorithm:
# create HLC relative to O
data$HO <- data[,2]-data[,1]
data$LO <- data[,3]-data[,1]
data$CO <- data[,4]-data[,1]
Next, the clustering algorithm itself. This is a vanilla implementation using the cluster package. The fpc package contains more options. Note that I set the random number seed so that the results are reproducible. Recall that the k-means algorithm begins its search for the optimum clusters with a random assignment, and that different initial guesses can result in different results. I experimented with different values for k, but settled on eight, as this value results in some visually appealing splits, as well as placing enough candles in each cluster to make some meaningful analysis of the results:
# # K-Means Clustering with clusters based on HO, LO, CO
class_factors <- data[, 5:7] # using H/O, L/O, C/O
set.seed(123)
fit <- kmeans(class_factors, 6)
m <- fit$cluster # vector of the cluster assigned to each candle
And here are the clusters for this particular run of the k-means algorithm with k = 6, and the code for generating them:
### which canldes were classifed into each cluster?
cluster <- as.xts(m)
index(cluster) <- index(data) # coerce index of cluster series to match data's index
new_data <- merge.xts(data, cluster)
chart_Series(xts(coredata(new_data)[order(new_data$cluster),],type="candlesticks", order.by = index(new_data),  theme = chartTheme('black',up.col='green',dn.col='red')))
 This is all well and good and we have learned a little about our price data – namely that its candlestick representations can be naturally grouped into the clusters shown. However, as I touched on above, this is the easy part. Is there any actionable intelligence resulting from this analysis that can lead to a profitable trading strategy? This will be the subject of my next post.
See also this article: https://intelligenttradingtech.blogspot.com/2010/06/quantitative-candlestick-pattern.html


Ilya,
Thanks for reading and being gracious enough to save your commentary. As I mentioned in the article, I intend to investigate methods of actioning the intelligence gleaned from the k-means implementation in the next post. Of course, the conclusion may well be that nothing useful enough to trade arose from the analysis. Or maybe something interesting will turn up. Who knows?
If you have anything helpful to contribute – suggestions, criticisms, whatever – please comment. I’m always willing and eager to learn from those more knowledgeable than I.
Interesting work,
A lot of people will outright discourage using machine learning because they have not found success with it. I am in the other camp. I know for a fact that it works and always like to see other people taking a crack a it.
I recall seeing a paper where the author would come up with state transition probabilities based on which cluster tended to follow other clusters. They then used it in a HMM to make it a profitable strategy. The results were fairly interesting. I can’t recall what paper it was for the life of me but I thought the rough intuition might give you an interesting avenue of inquiry for future posts.
Regarding the previous comment, you know which cluster you are in as soon as the bar completes which is no later than any other strategy based on bar data. After that it is a simple matter of calculating your features and finding which cluster center is the closest in feature space to your latest bar.
QF, thanks for commenting!
I’ve noticed that it is common for traders who try it to dismiss machine learning due to problems related to over-fitting. But to me, that is a failure of the model development process, not a failure of the particular algorithm being used or of machine learning in general. I’ve also had more than one person tell me that they gave up on it because they want something they can just feed data to and get ‘the’ answer!
I actually was going to investigate patterns of which clusters followed each other in my next post, but I hadn’t considered modelling the state transition probabilities in a HMM. I’ll see if I can locate that paper you referred to. Sounds really interesting.
Good call regarding the previous comment too. Once the bar completes, the time required to figure out the bar’s cluster is merely a function of the complexity of your feature space and your computer’s processing power!
RM
You are thinking of Intelligent Trading Tech’s blog post:
https://intelligenttradingtech.blogspot.com/2010/06/quantitative-candlestick-pattern.html
Your approach is markedly similar.
Kyle, thanks for posting that link. I’ve added it to the main text as a reference.
Yes , but there is an actual paper. I remembered this one but the one I am referring to had a much more detailed treatment. Still a good reference though. Had that one bookmarked for sure.
Hello Robot Wealth – not sure any other way to contact you, so I’m using your comments section. Would you mind emailing me at the enclosed email address? Thanks!
Really nice post!
Just a wonder:
If it make sense to analyze which cluster follows the current cluster. The question which comes to my mind is: Can then both clusters be considered a cluster as well? Like a “Second Order Cluster”
Mariano, thanks for commenting. You could certainly create clusters out of more than one candle. In fact, you could feed whatever information you liked to the clustering algorithm. I wrote about this briefly in the ‘Conclusions and future research directions’ section in part 2 of this series. If you are interested, you can take the code I included in that post and modify it to include other data – I would be very interested to hear about the results.