Previously: A Tale of Two Prices (the core idea of stat arb)
Last time we established that stat arb is really about betting on divergence/convergence behaviour continuing. Two things that have historically moved together come apart, and you bet on them coming back together.
Remember the forced flows example, some fund or whatever having to sell regardless of price? That sort of temporary dislocation creates opportunities.
Conceptually simple. But the question is: how do you find pairs that actually do this reliably?
This is where I went wrong for a long time. I spent way too long in the early days getting hung up on the wrong things.
—
If you’ve read anything about pairs trading, you’ve probably come across discussions of Kalman filters, Ornstein-Uhlenbeck models, optimal hedge ratios.
I got really hung up on that stuff when I first started. I thought the algorithm details were the important part.
They’re not.
At the end of the day, all of that stuff is a minor implementation detail. Really, 80 to 90 per cent of the whole pairs trading game is just finding stuff that tends to drift apart and come back together.
Unsexy, but true.
If you can find two things that reliably diverge and converge, my six-year-old could trade them and make money. Seriously. The trading logic is the easy part. Long the cheap one, short the expensive one, wait for convergence. Done.
Of course, nothing is that simple. The hard part is finding those things in the first place. And then managing them with all the trade-offs, constraints and limitations that you inevitably run up against (that’s coming in article 3, by the way).
—
Let me start with what doesn’t work as well as you’d hope: cointegration testing.
Cointegration is one of those things that sounds perfect for pairs trading. It’s a statistical property that says two time series tend to move together over time, even if they wander individually. Exactly what we want, right?
The problem is practical, not theoretical.
If you try to measure a cointegration coefficient over a rolling window, you’ll find it’s incredibly unstable. The relationship looks solid and sensible when you look at the full sample. But in real time, the coefficient swings around wildly. It changes sign. It breaks down completely for long stretches.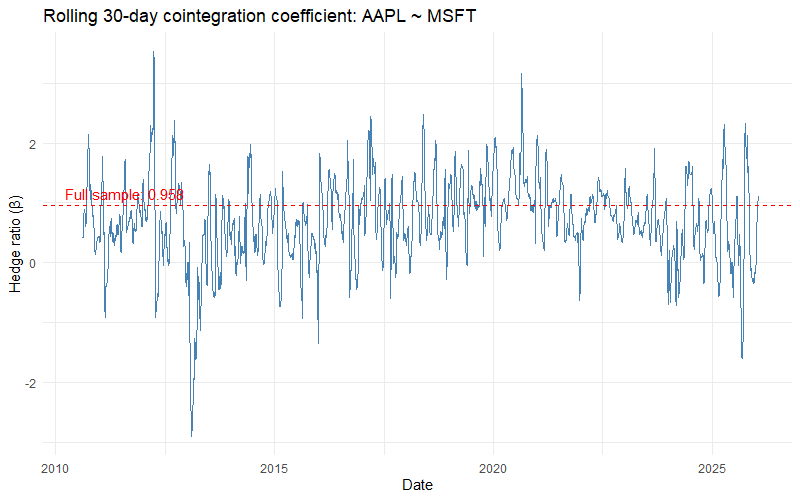
Same story with correlation, by the way. High historical correlation doesn’t tell you much about whether the spread will mean-revert going forward.
The fundamental problem with these statistical tests is that they’re measuring the wrong thing. They’re measuring statistical properties of the relationship, not the thing we actually care about: does this spread tend to diverge and converge in a tradeable way?
—
So what should you look for instead?
The answer is to measure the thing you actually care about as directly as possible.
You care about two things:
- Do these things stay close together? If they tend to drift apart permanently, you don’t have a tradable pair.
- When they do come apart, do they come back together? This is the mean reversion behaviour you’re trying to capture.
Rather than trying to infer these properties from statistical tests, you can measure them directly.
There are various ways to do this.
One approach is to look at what we might call the “distance” between two normalised price series over a period. If the distance is consistently low, the pair stays close together. That’s good.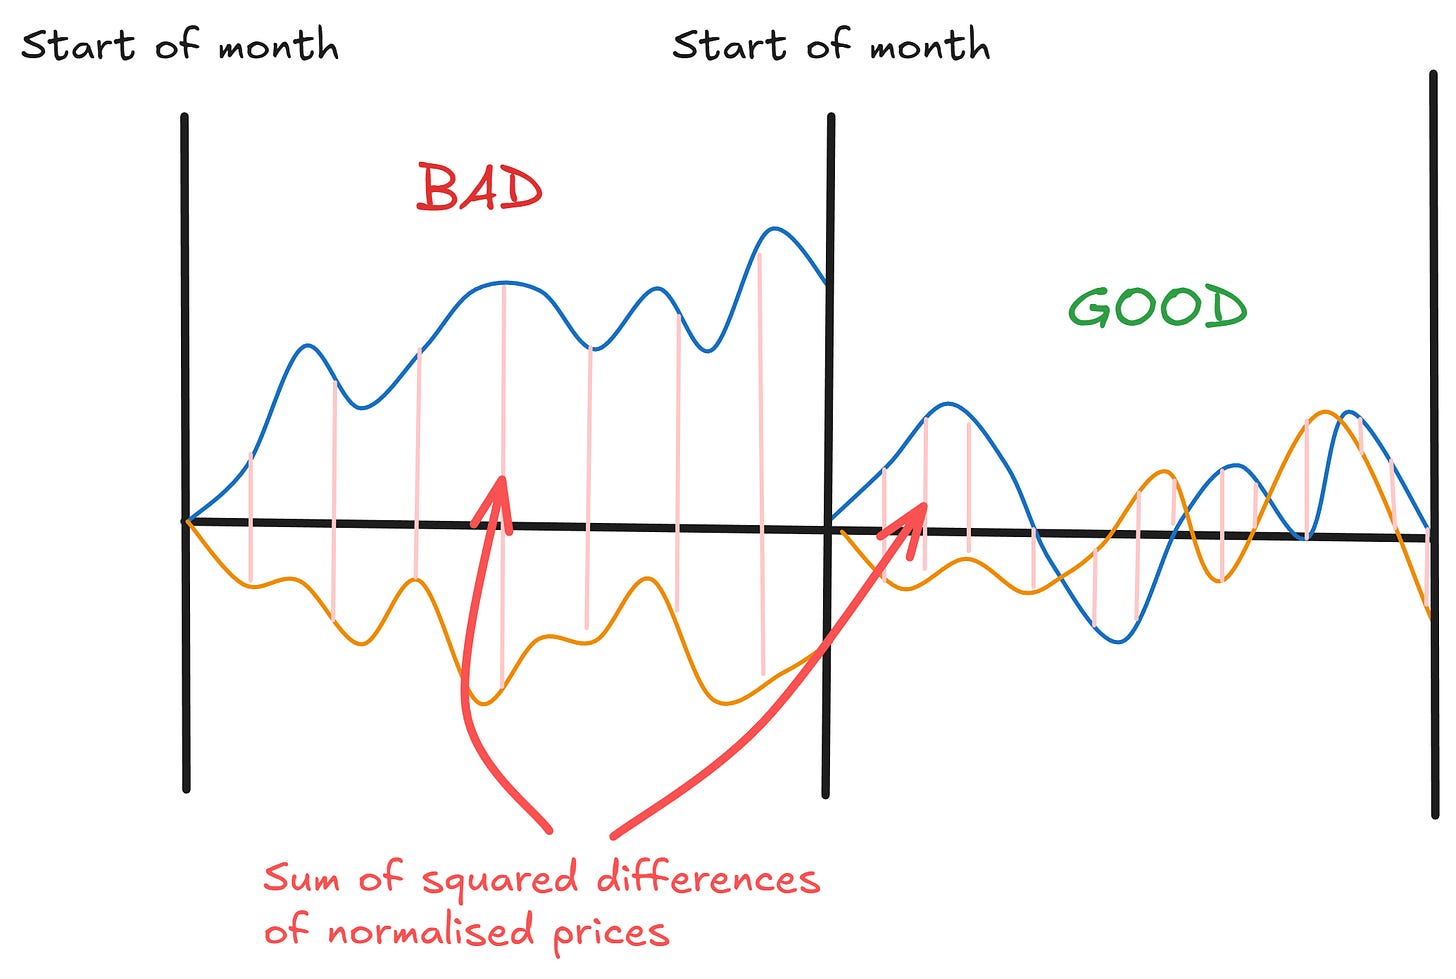
Another approach is to look at a kind of simulated frictionless return from trading mean reversion on the spread. If this historical return is high, the pair has exhibited strong mean reversion. Also good.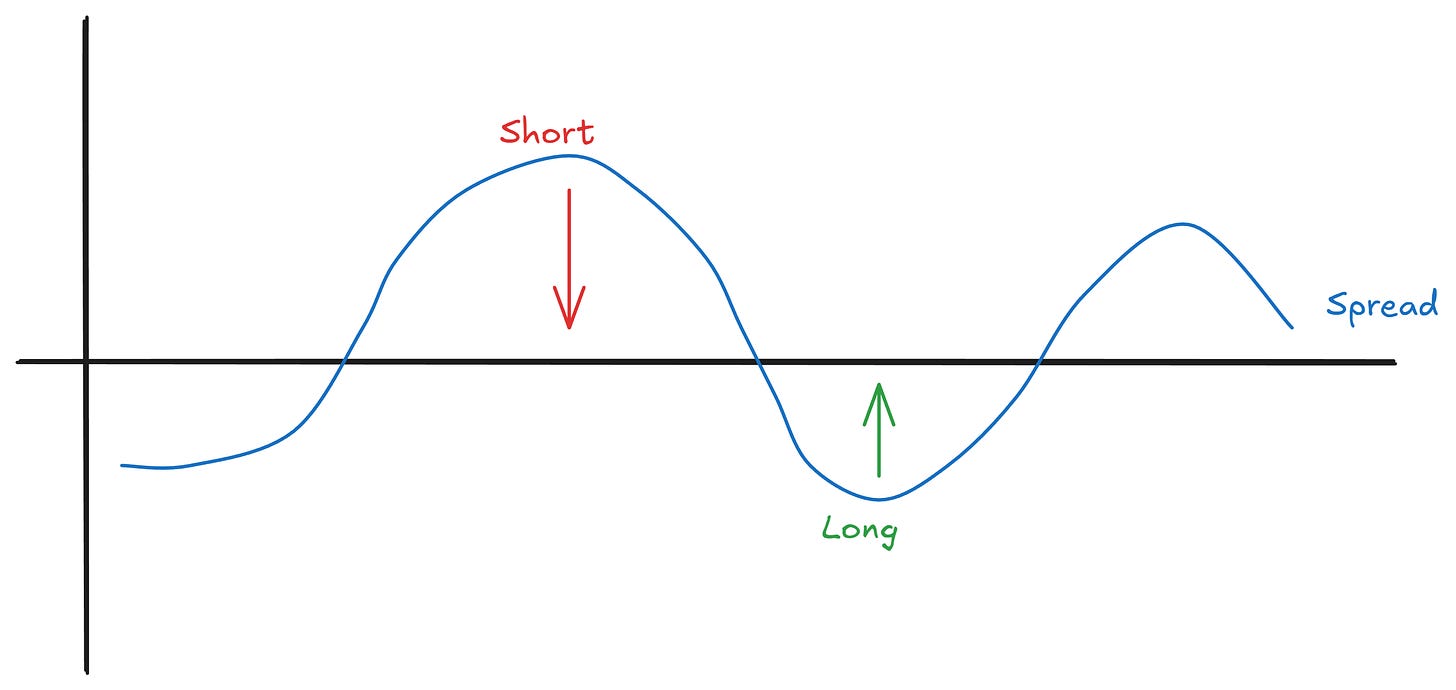
Neither of these on their own is perfect. But when you combine them, you start to filter out a decent chunk of the noise.
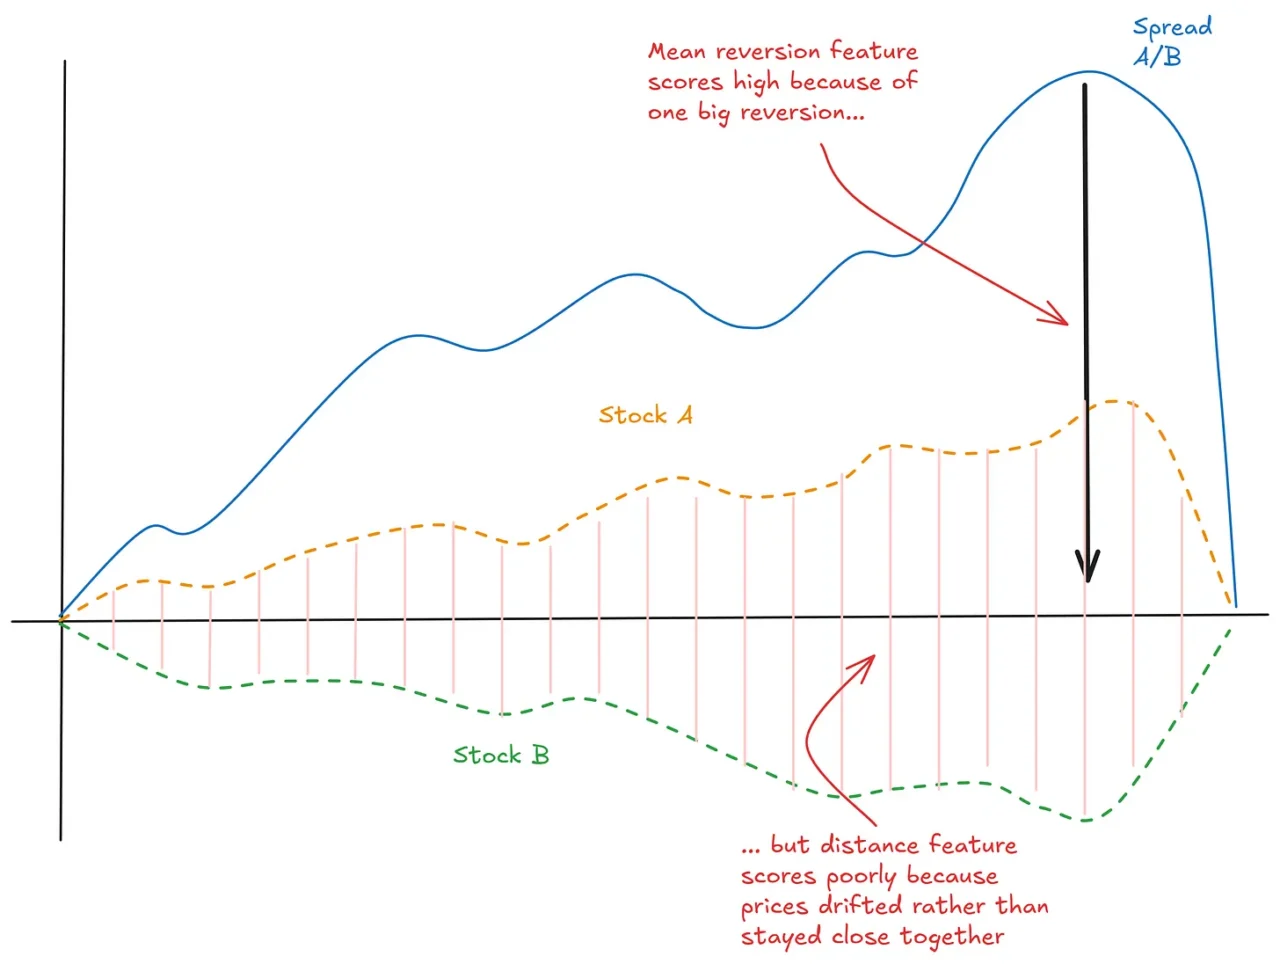
For example, a pair like this will score a high total return on the mean reversion metric (makes a high return due to one convergence event), but score poorly on the distance feature (prices drifted rather than stayed close together):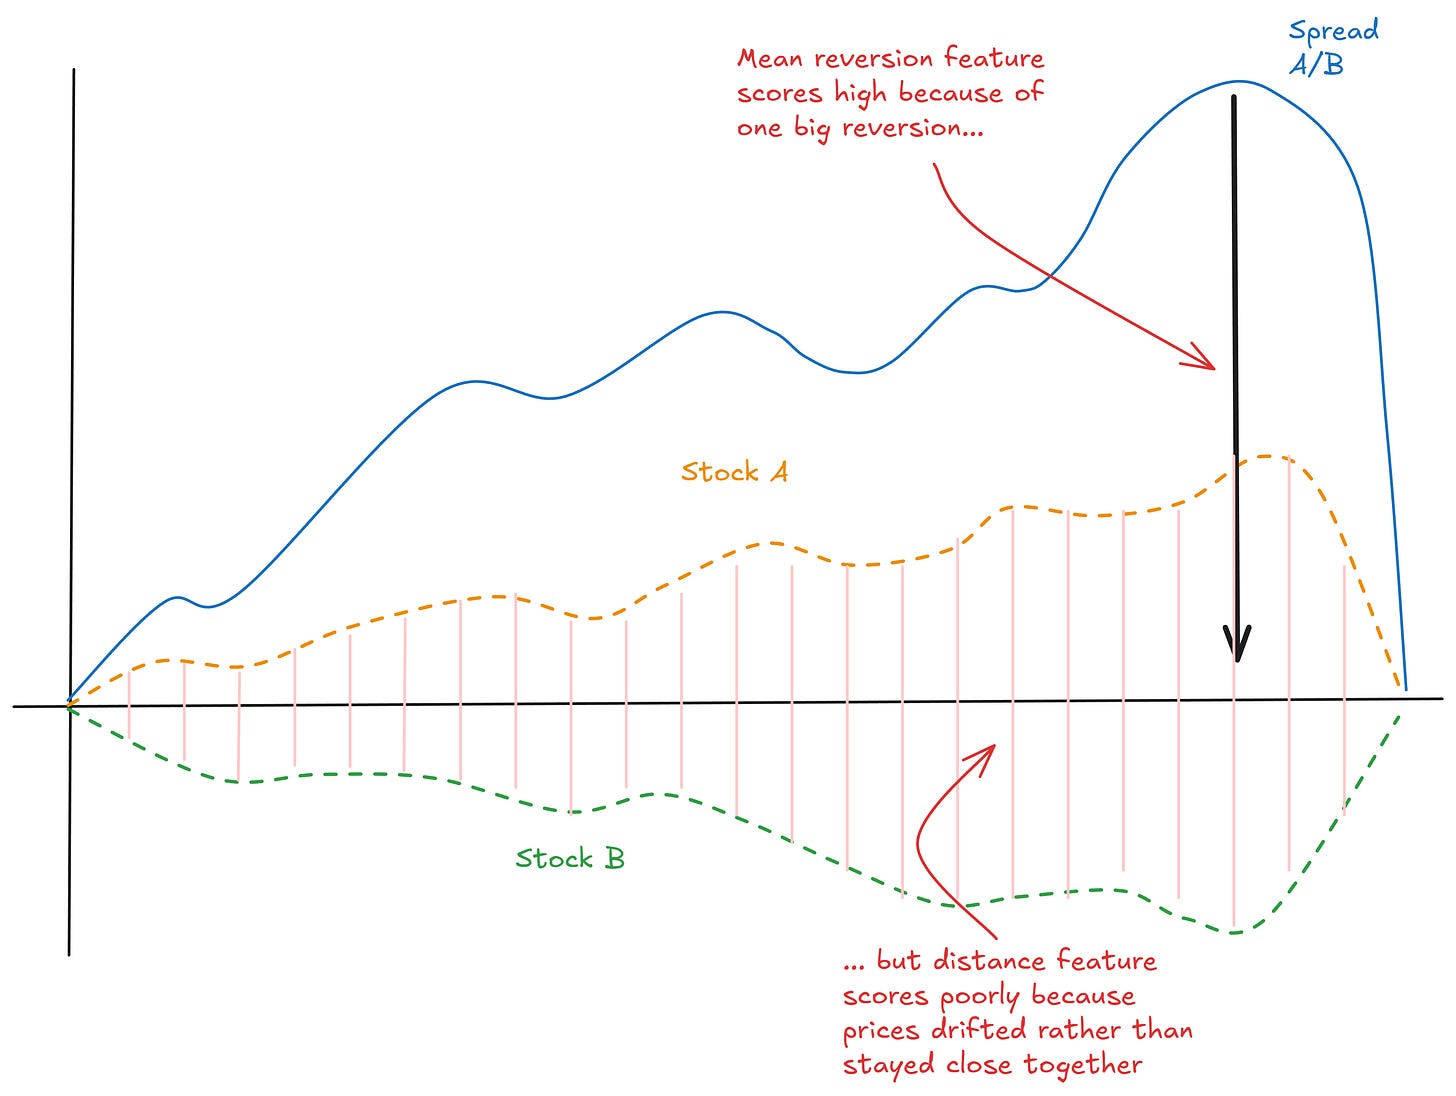
A pair that scores well on both metrics, that stays close together, and has strong mean reversion, that’s the kind of pair you want.
And critically, these metrics tend to persist. Pairs that scored well in one period tend to score well in the next period, too. That persistence is the whole basis for using them as selection criteria.
Without persistence, we’d just be fitting to a past with no insight as to whether it should repeat.
Related point: Never assume persistence… always go look in the data and see if it actually exists.
—
Another ingredient: don’t bother with pairs that don’t make sense.
Similar industry or sector is a good baseline. Two oil stocks are exposed to similar underlying factors. Two tech companies, two banks, two retailers. They have similar risk exposures.
When one temporarily gets pushed out of line relative to the other, and it’s not for fundamental reasons, you’d expect them to converge. They’re exposed to the same stuff.
If you try to pair random stocks together just because they look statistically related, you’re asking for trouble. Spurious correlations break down. Pairs with no fundamental connection can diverge permanently when something changes for one of them.
So the process looks something like this:
- Start with pairs that make structural sense (same industry)
- Filter for pairs that have stayed close together historically
- Filter for pairs that have shown strong mean reversion
- Rank by some combination of those metrics
- Take the top N
That’s really the skeleton of it.
—
The most important thing I can tell you about universe selection is this: focus on finding pairs whose natural divergence and convergence makes sense.
Don’t focus on finding pairs that pass some statistical test. Don’t focus on proving that a relationship is “statistically significant.” Don’t get lost in the academic weeds.
Instead, look as directly as possible at the thing you care about. Does this spread drift apart and come back together? Measure that. Use metrics that capture that behaviour. Then test whether pairs that score well on those metrics continue to score well going forward.
If they do, you’ve got something. If they don’t, the metric isn’t useful, no matter how statistically sophisticated it is.
—
Now, there’s a catch (there’s always a catch).
Even when you’ve got a really good selection process, even when you’ve identified hundreds of pairs that look genuinely good, you still have to trade them.
And that’s where the traditional pairs trading approach hits some painful walls. Capital constraints. Transaction costs. The fact that you can only practically trade maybe 10-20 pairs at a time, depending on your setup.
Your selection pipeline might identify a couple of hundred great pairs. But if you can only trade 10 of them, what happens to the rest? All that signal, all that information, essentially gets thrown away.
That makes me sad.
This is the limitation of traditional pairs trading for the indie trader. And it’s something that’s been frustrating me for a long time… ever since I left the prop world, now that I think about it.
Next time, we’ll dig into exactly what those limitations look like in practice, and why they matter more than you might think. Then, I’ll show you how I get around them.
Free Case Study:
A wantaway engineer’s journey into professional trading and out again
I went from engineering to an equity partnership at a prop trading firm to running my own systematic trading operation from home in Western Australia.
This case study is the full story – every mistake, every breakthrough, and some things I trade today.


2 thoughts on “Moneyball: Finding Undervalued Pairs Using Unconventional Metrics”