Part 1 of a series on Statistical Arbitrage for Independent Traders.
It was the age of wisdom, it was the age of foolishness…
I’ve seen heaps of stuff published online about stat arb lately. Some genuinely good takes. And some other material that, while academically interesting, isn’t particularly useful for people like me and the people I write for: independent systematic traders looking for real edges we can realistically manage without a team.
A lot of the stat arb “literature” makes this whole thing sound more complicated than it needs to be. Cointegration tests, optimal hedge ratios, Ornstein-Uhlenbeck processes.
Best case, some of that stuff might be useful if you’re running a big operation and tinkering at the margins is justified.
But for most of us, it just obscures the fundamentals.
And the fundamentals of statistical arbitrage are actually pretty simple. Understanding those matters more than the fancy maths.
So let’s begin from first principles.
Actual Arbitrage
To understand statistical arbitrage, you need to understand regular arbitrage first.
Imagine you’ve got a crypto meme coin trading on two exchanges. On Exchange A, you can buy it at 101 and sell at 99. On Exchange B, you can buy at 103 and sell at 102.
Same asset. Different prices.
There’s an obvious trade. Buy at 101 on Exchange A, transfer it over to Exchange B, sell at 102.
Make a dollar, risk-free (allegedly).
This is pure arbitrage. You’re buying and selling the same thing at different prices. Theoretically riskless.
Except it’s not really riskless in practice.
The asset transfer costs money and takes time. And while you’re waiting for the transfer to complete, the market moves. By the time your crypto lands on Exchange B, the price might have changed.
So pure arbitrage is theoretically riskless, but practically hard to capture.
And because it’s such an attractive trade, it’s extremely rare. And if you happen to find a persistent one, it’s only a matter of time before others notice, pile in, and before you know it, it’s gone.
But I digress. The thing to know is that every good trading idea basically looks like this. You’re identifying when something is cheap or expensive relative to where it should be, and you’re taking advantage of that difference.
That’s trading in a nutshell.
Enter the Pairs Trade
So if pure arbitrage is hard to find and hard to execute, how else might we trade this general idea?
What if, instead of buying on Exchange A, transferring the asset, and selling on Exchange B, we just bought on A and sold on B at the same time?
No transfer. We’re just long on one exchange and short on the other, simultaneously.
Now we’re not doing arbitrage anymore. We’re doing a pairs trade.
The key difference is that in pure arbitrage, you realise your profit immediately when you complete the transfer. In a pairs trade, you’ve got to wait for the prices to converge.
You bought the cheap one, you sold the expensive one. But you haven’t made any money yet. You need those prices to come back into line.
This is a really important point, and it sounds obvious, but it’s easy to forget. The pairs trade is a bet on convergence. You’re betting that the spread between the two instruments will narrow.
Aside: You can use this to filter the useful-to-the-indie-trader stat arb articles I mentioned at the start of this piece… if the article doesn’t focus on this core divergence-convergence idea (how to find it, how to measure it, how to understand it, how to trade it, etc.) then you can safely move on.
Why “Statistical” Arbitrage?
So why do we call it statistical arbitrage rather than just arbitrage?
When I first heard about this idea, I assumed the name was because it’s about using statistics to find arbitrage relationships or something like that.
But that would be entirely wrong.
It’s because there’s no guarantee the spread converges.
In pure arbitrage, convergence is guaranteed (the same asset has to trade at the same price eventually). In stat arb, convergence is probabilistic. It’s not certain.
It’s a bet on expected convergence, not guaranteed price changes.
The spread could widen instead of narrowing. One exchange could have problems. The relationship could break down entirely.
So you’re making a statistical bet. On average, over many trades, you expect this behaviour to work out in your favour. But any individual trade could lose.
This is important to understand. A lot of material out there gives you the impression that stat arb is about finding cointegrated pairs or getting hedge ratios right. That stuff obscures the fundamental thing we actually care about: prices drifting apart and coming back together again.
It’s really no more complicated than that.
But equally, don’t mistake simple for easy.
Stat arb is conceptually very simple. But it’s not an easy trade to do well (is anything?).
And if you complicate the simple part (the core idea), you really lower your chances of doing the not-simple part successfully… if at all.
This is an underappreciated point.
It sounds like a throw-away line that you might be able to get away with ignoring:
“Focus on the core idea of divergence-convergence.”
But it takes a surprising amount of care, nuance, and, dare I say, skill to actually implement a portfolio around this core idea. Especially at any sort of scale.
If you focus on the wrong stuff at the front end (cointegration, I am looking at you), you waste precious time and energy that could be spent figuring out what actually moves the dial. Trust me, you can’t afford that wasted time.
In one of the later articles in this series (article 3 if all goes to plan… no promises), I’ll talk about a simple implementation that an indie trader can realistically do. Its simplicity comes with certain trade-offs, but it’s a decent place to start.
What Drives Divergence and Convergence?
Okay, so we’re betting on prices diverging and converging. But why would this happen reliably?
Let’s think about what drives divergence first.
Most of the time, when one leg of a pair gets pushed out of line, it’s because of some temporary imbalance in supply and demand. Someone needed to buy or sell for reasons that have nothing to do with the fundamental value of the asset.
Index rebalancing flows. Hedging needs. Liquidity requirements. Some bloke at a fund got a redemption and had to sell, regardless of price.
These are what smart people call “forced flows” or “price-insensitive” participants. They’re not trading because they think the asset is mispriced. They’re trading because they have to.
And this creates temporary mispricings.
Now, why would convergence happen?
If the assets are exposed to similar risk factors, and one gets pushed out of line by someone trading because they have to, it should come back. The mispricing isn’t fundamental. It’s noise. And noise tends to mean-revert. People will notice that it’s mispriced and take advantage of that until it’s no longer mispriced.
That’s the core bet. There’s nothing magical (or particularly statistical) about it. Just: things that should trade together got temporarily pushed apart, and you expect them to come back together.
Simple Concept, Less Simple Implementation
The biggest thing I want you to take away from this is that stat arb, as a concept, is simpler than people make it sound.
You identify things that have historically moved together but also tend to come apart and come back together. You trade deviations from that relationship.
When they diverge, you bet on convergence. Essentially, it’s a bet on the divergence/convergence behaviour continuing.
Now, that’s conceptually simple.
But as soon as you start thinking about the details, things get complicated quickly.
The most obvious question is, how do you find pairs that exhibit this behaviour reliably?
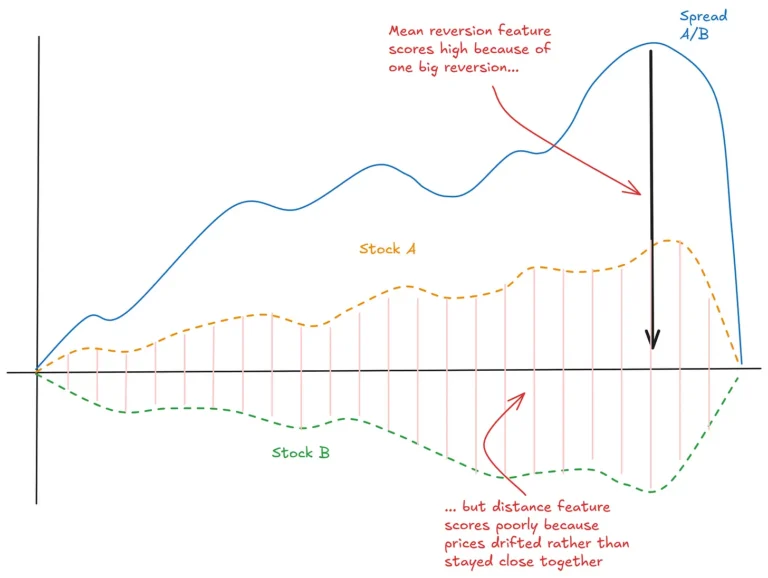
And when you start doing the trade, you find that spreads diverge for fundamental reasons, too. Assets reprice on genuine changes in their outlooks, and that sort of divergence doesn’t converge.
So how do you deal with that?
These are examples of details that are genuinely worth your time trying to figure out. They relate directly to the core effect we’re looking for.
That’s where I went wrong when I first started doing this.
I reached for statistical tools (cointegration, correlation, whatever) without thinking about what actually drives the relationship. Spoiler: those statistical tests aren’t as useful as you’d hope (estimation error, non-stationarity, the usual suspects).
The reality is: if you can find two things that tend to move apart and come back together reliably, you could ask my six-year-old son to trade them, and he’d make money.
The trading logic is the easy part. If only it were all that easy! The hard part is finding those things in the first place.
So next time, we’ll dig into that. How do you actually find pairs and divergences worth trading? What should you look for, and what should you avoid?
I’m also planning to write about the stat arb journey we’ve been on in the RW Pro community, where we took a solid pairs trade and evolved it into a more scalable and performant stat arb portfolio. Lots of interesting lessons to share.
Free Case Study:
A wantaway engineer’s journey into professional trading and out again
I went from engineering to an equity partnership at a prop trading firm to running my own systematic trading operation from home in Western Australia.
This case study is the full story – every mistake, every breakthrough, and some things I trade today.


2 thoughts on “A Tale of Two Prices”