PythonQuant tradingTrading infrastructure
Why We Use Apache Beam For Our Systematic Trading Data Pipeline
In the world of Big Data, there are lots of tools and technologies to choose from. Choosing the “right” one
In the world of Big Data, there are lots of tools and technologies to choose from. Choosing the “right” one
Holding data in a tidy format works wonders for one’s productivity. Here we will explore the tidyr package, which is

Anyone that’s been around the markets knows that the monthly release of the United States Department of Labor’s Non-Farm Payrolls

Here’s a round-up of our new articles this week. They cover crash protection, sloppy, noisy regressions, and data-munging skills. Finding

When data is too big to fit into memory, one approach is to break it into smaller pieces, operate on

When you’re working with large universes of stock data you’ll come across a lot of challenges: Stocks pay dividends and
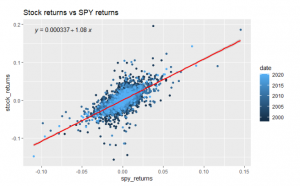
One way we can quantify a stock’s movement relative to the market index is by calculating its “beta” to the
In today’s article, we are going to take a look at rolling and expanding windows. By the end of the

Here’s a round-up of our new articles this week. They cover options trading, digital signal processing, data munging and Kris’s luxurious

Recently, we wrote about calculating mean rolling pairwise correlations between the constituent stocks of an ETF. The tidyverse tools dplyr

Working with modern APIs you will often have to wrangle with data in JSON format. This article presents some tools

In this post, we look at tools and functions from the field of digital signal processing. Can these tools be